[1] TRUE13 Workload Analysis
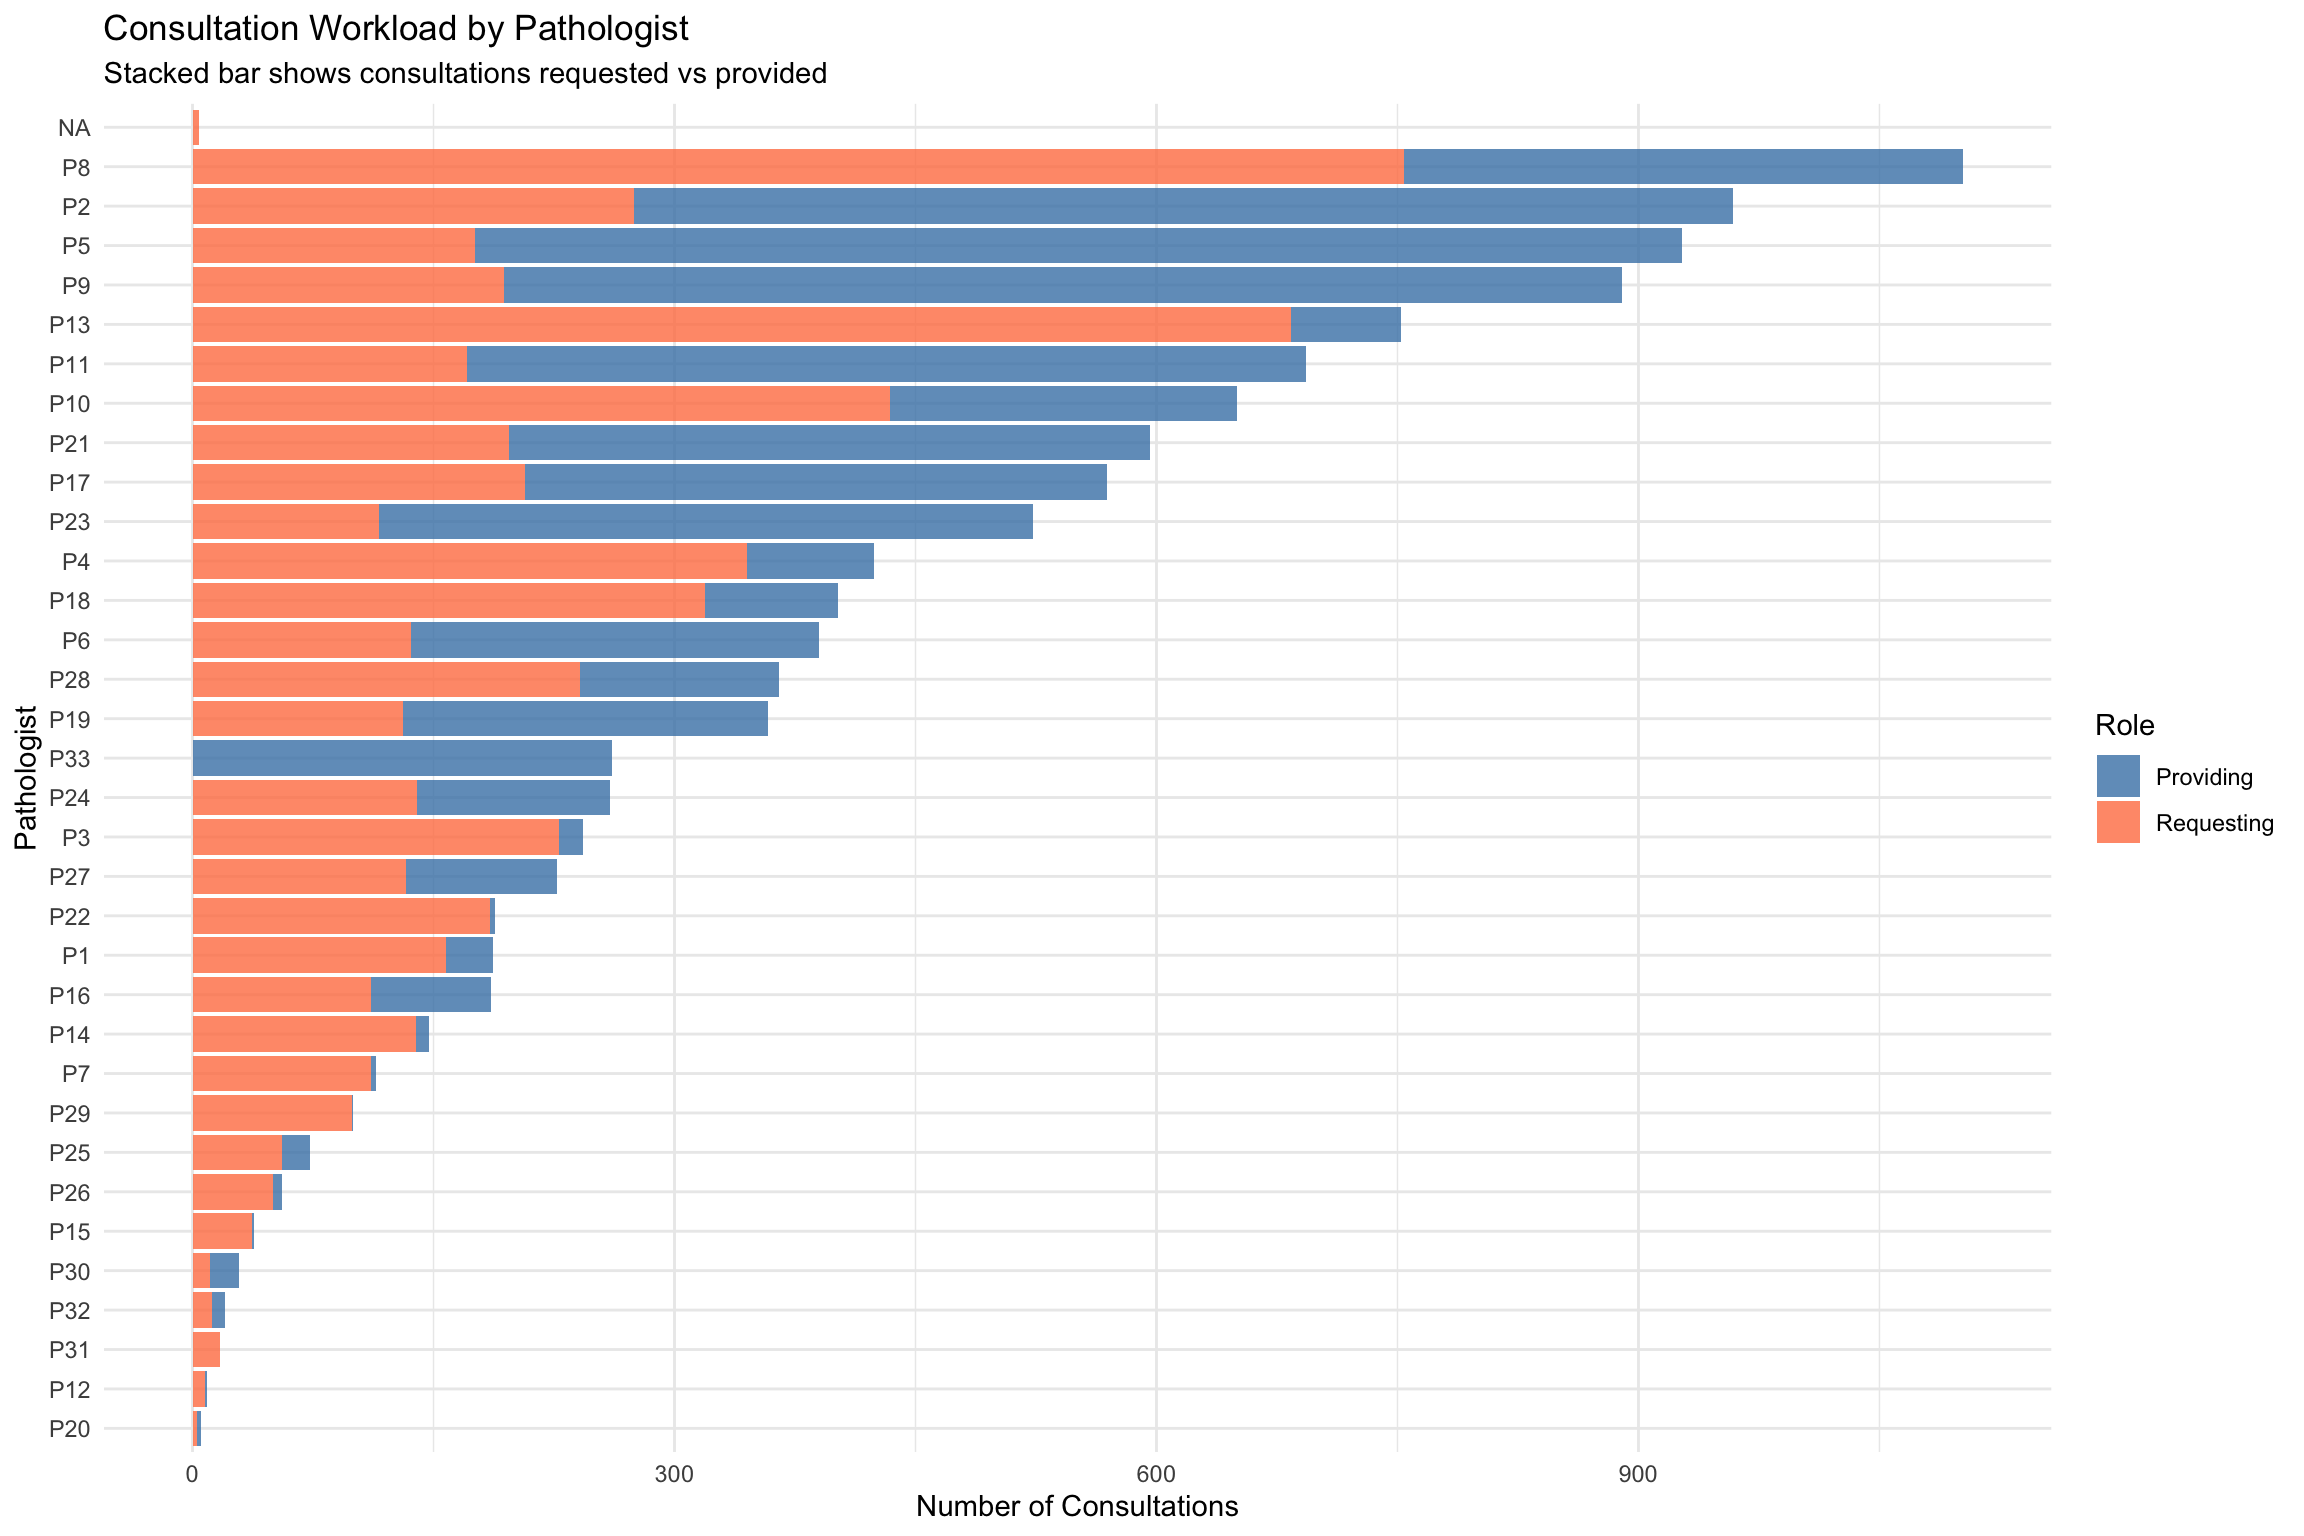
This chapter examines consultation workload distribution and capacity utilization across pathologists. Pathologist workload has been evolving significantly, with increasing case complexity and specimen volumes documented in multi-year studies (Bonert et al. 2021). Equitable workload distribution is critical for preventing burnout and maintaining diagnostic quality (Hanna et al. 2024), and accurate workload measurement remains a challenge in modern pathology practice (Cheung et al. 2015). A recent comparative analysis of three workload measurement methodologies (RBRVS, L4E, and AABACUS) demonstrated that traditional RVU-based systems tend to underestimate actual workload because they cannot account for factors such as slide count or the need for intradepartmental consultation, while activity-based systems show much higher inter-method correlation (Pantelakos and Agrogiannis 2023).
A key advantage of fully digital consultation workflows is the visibility they bring to previously “invisible work.” In analog departments, informal glass-slide consultations were largely unrecorded — a pathologist might spend substantial time reviewing colleagues’ cases without this effort appearing in any workload metric (Goebel, Ettler, and Walsh 2018). Digital consultation systems log every request, creating an objective record of consultation burden that can be integrated into workload fairness assessments. Studies of whole-slide imaging workflows have demonstrated a 12.3% average efficiency gain across case types, with prostate biopsies showing up to 68% time savings (Baidoshvili et al. 2021), underscoring the potential for digital systems to improve not only visibility but also efficiency of consultation work.
13.1 Overall Workload Distribution
13.1.1 Consultation Volume per Pathologist
| Pathologist | As_Asker | As_Responder | Total | Balance | Pct_Asker | Pct_Responder |
|---|---|---|---|---|---|---|
| P8 | 754 | 348 | 1102 | -406 | 68.4 | 31.6 |
| P2 | 275 | 684 | 959 | 409 | 28.7 | 71.3 |
| P5 | 176 | 751 | 927 | 575 | 19.0 | 81.0 |
| P9 | 194 | 696 | 890 | 502 | 21.8 | 78.2 |
| P13 | 684 | 68 | 752 | -616 | 91.0 | 9.0 |
| P11 | 171 | 522 | 693 | 351 | 24.7 | 75.3 |
| P10 | 434 | 216 | 650 | -218 | 66.8 | 33.2 |
| P21 | 197 | 399 | 596 | 202 | 33.1 | 66.9 |
| P17 | 207 | 362 | 569 | 155 | 36.4 | 63.6 |
| P23 | 116 | 407 | 523 | 291 | 22.2 | 77.8 |
| P4 | 345 | 79 | 424 | -266 | 81.4 | 18.6 |
| P18 | 319 | 83 | 402 | -236 | 79.4 | 20.6 |
| P6 | 136 | 254 | 390 | 118 | 34.9 | 65.1 |
| P28 | 241 | 124 | 365 | -117 | 66.0 | 34.0 |
| P19 | 131 | 227 | 358 | 96 | 36.6 | 63.4 |
| P33 | 0 | 261 | 261 | 261 | 0.0 | 100.0 |
| P24 | 140 | 120 | 260 | -20 | 53.8 | 46.2 |
| P3 | 228 | 15 | 243 | -213 | 93.8 | 6.2 |
| P27 | 133 | 94 | 227 | -39 | 58.6 | 41.4 |
| P22 | 185 | 3 | 188 | -182 | 98.4 | 1.6 |
| P1 | 158 | 29 | 187 | -129 | 84.5 | 15.5 |
| P16 | 111 | 75 | 186 | -36 | 59.7 | 40.3 |
| P14 | 139 | 8 | 147 | -131 | 94.6 | 5.4 |
| P7 | 111 | 3 | 114 | -108 | 97.4 | 2.6 |
| P29 | 99 | 1 | 100 | -98 | 99.0 | 1.0 |
| P25 | 56 | 17 | 73 | -39 | 76.7 | 23.3 |
| P26 | 50 | 6 | 56 | -44 | 89.3 | 10.7 |
| P15 | 37 | 1 | 38 | -36 | 97.4 | 2.6 |
| P30 | 11 | 18 | 29 | 7 | 37.9 | 62.1 |
| P32 | 12 | 8 | 20 | -4 | 60.0 | 40.0 |
| P31 | 17 | 0 | 17 | -17 | 100.0 | 0.0 |
| P12 | 8 | 1 | 9 | -7 | 88.9 | 11.1 |
| P20 | 3 | 2 | 5 | -1 | 60.0 | 40.0 |
| NA | 4 | 0 | 4 | -4 | 100.0 | 0.0 |
13.1.2 Workload Distribution Visualization
13.2 Workload Balance Analysis
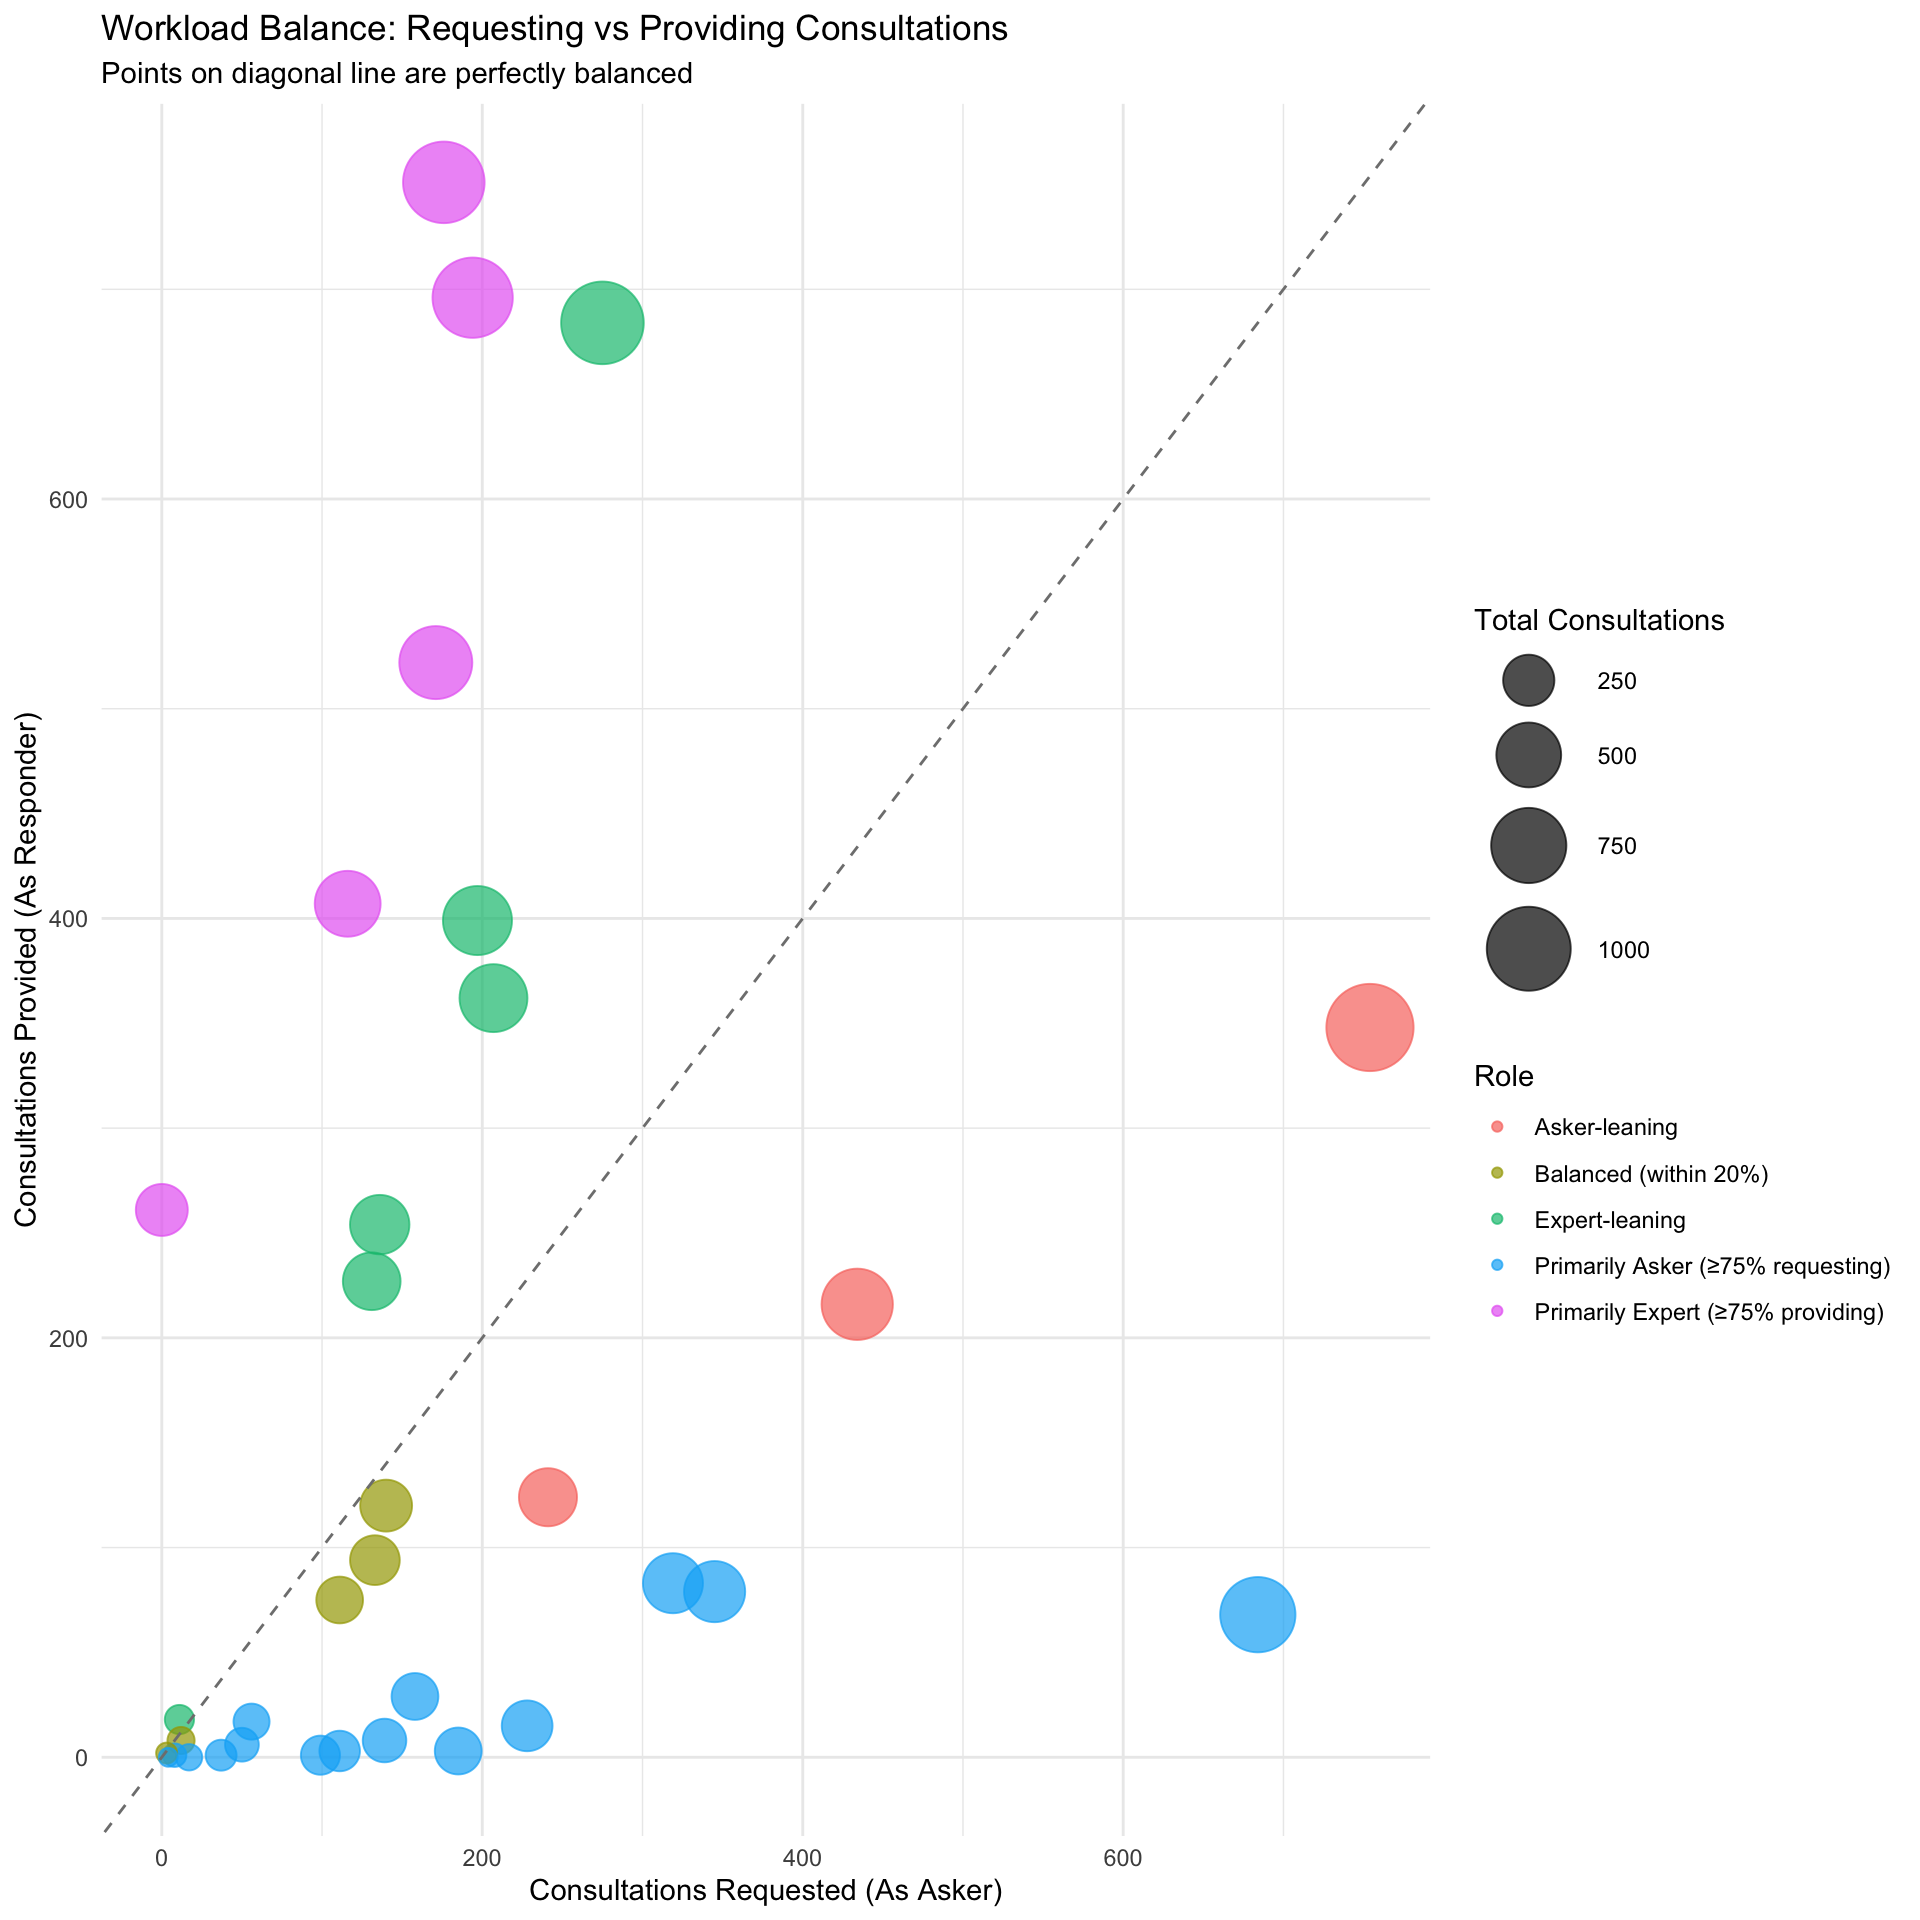
Understanding the balance between consultation-requesting and consultation-providing roles is important for workforce planning (Metter et al. 2019). Subspecialty practice patterns significantly influence consultation dynamics (Parkash et al. 2018).
13.2.1 Identifying Roles
Classify pathologists based on their consultation patterns:
| Role | N_Pathologists | Avg_Total_Consultations | Total_Consultations |
|---|---|---|---|
| Primarily Asker (≥75% requesting) | 15 | 183.6 | 2754 |
| Expert-leaning | 6 | 483.5 | 2901 |
| Balanced (within 20%) | 5 | 139.6 | 698 |
| Primarily Expert (≥75% providing) | 5 | 658.8 | 3294 |
| Asker-leaning | 3 | 705.7 | 2117 |
| Pathologist | Role | As_Asker | As_Responder | Total |
|---|---|---|---|---|
| P8 | Asker-leaning | 754 | 348 | 1102 |
| P2 | Expert-leaning | 275 | 684 | 959 |
| P5 | Primarily Expert (≥75% providing) | 176 | 751 | 927 |
| P9 | Primarily Expert (≥75% providing) | 194 | 696 | 890 |
| P13 | Primarily Asker (≥75% requesting) | 684 | 68 | 752 |
| P11 | Primarily Expert (≥75% providing) | 171 | 522 | 693 |
| P10 | Asker-leaning | 434 | 216 | 650 |
| P21 | Expert-leaning | 197 | 399 | 596 |
| P17 | Expert-leaning | 207 | 362 | 569 |
| P23 | Primarily Expert (≥75% providing) | 116 | 407 | 523 |
| P4 | Primarily Asker (≥75% requesting) | 345 | 79 | 424 |
| P18 | Primarily Asker (≥75% requesting) | 319 | 83 | 402 |
| P6 | Expert-leaning | 136 | 254 | 390 |
| P28 | Asker-leaning | 241 | 124 | 365 |
| P19 | Expert-leaning | 131 | 227 | 358 |
| P33 | Primarily Expert (≥75% providing) | 0 | 261 | 261 |
| P24 | Balanced (within 20%) | 140 | 120 | 260 |
| P3 | Primarily Asker (≥75% requesting) | 228 | 15 | 243 |
| P27 | Balanced (within 20%) | 133 | 94 | 227 |
| P22 | Primarily Asker (≥75% requesting) | 185 | 3 | 188 |
| P1 | Primarily Asker (≥75% requesting) | 158 | 29 | 187 |
| P16 | Balanced (within 20%) | 111 | 75 | 186 |
| P14 | Primarily Asker (≥75% requesting) | 139 | 8 | 147 |
| P7 | Primarily Asker (≥75% requesting) | 111 | 3 | 114 |
| P29 | Primarily Asker (≥75% requesting) | 99 | 1 | 100 |
| P25 | Primarily Asker (≥75% requesting) | 56 | 17 | 73 |
| P26 | Primarily Asker (≥75% requesting) | 50 | 6 | 56 |
| P15 | Primarily Asker (≥75% requesting) | 37 | 1 | 38 |
| P30 | Expert-leaning | 11 | 18 | 29 |
| P32 | Balanced (within 20%) | 12 | 8 | 20 |
| P31 | Primarily Asker (≥75% requesting) | 17 | 0 | 17 |
| P12 | Primarily Asker (≥75% requesting) | 8 | 1 | 9 |
| P20 | Balanced (within 20%) | 3 | 2 | 5 |
| NA | Primarily Asker (≥75% requesting) | 4 | 0 | 4 |
13.2.2 Balance Visualization
13.3 Workload Inequality Analysis
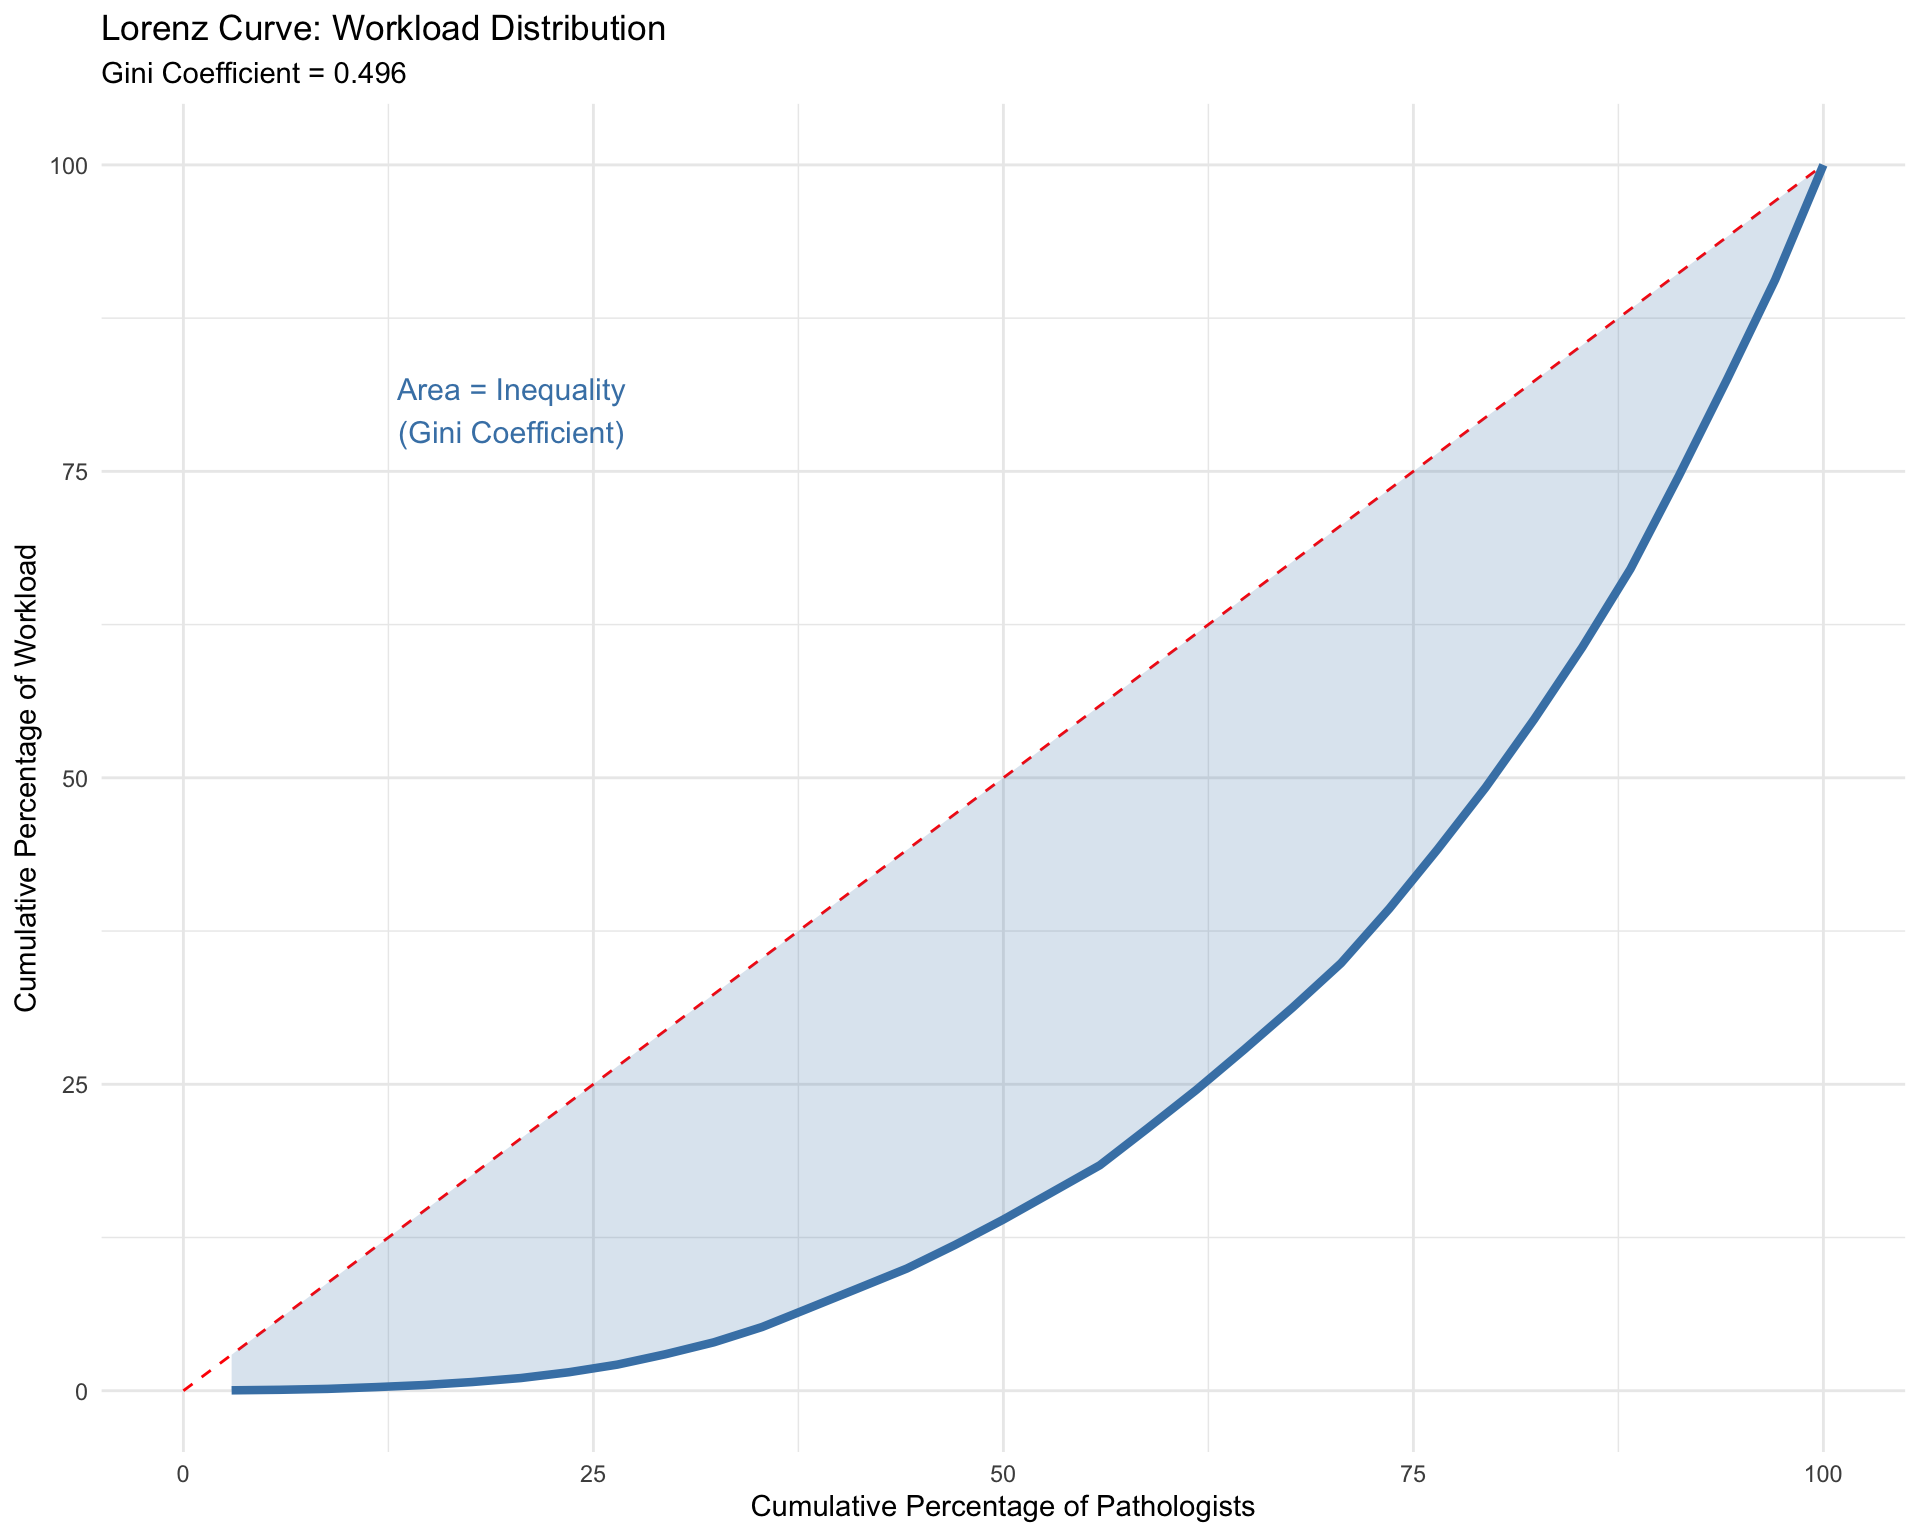
Workload inequality in pathology departments has been quantified using the Gini coefficient, with reported values ranging from 0.05 to 0.23 across hospital pathology groups (Bonert et al. 2022).
13.3.1 Gini Coefficient
Measure inequality in workload distribution:
| Measure | Gini Coefficient | Interpretation |
|---|---|---|
| Total Workload | 0.496 | High inequality (substantially above published pathology range) |
| As Asker | 0.488 | High inequality (substantially above published pathology range) |
| As Responder | 0.644 | High inequality (substantially above published pathology range) |
| Note: | ||
| Gini coefficient ranges from 0 (perfect equality) to 1 (perfect inequality). Bonert et al. (2022) reported Gini values of 0.05--0.23 across hospital pathology groups. |
13.3.2 Lorenz Curve
13.4 Capacity Analysis
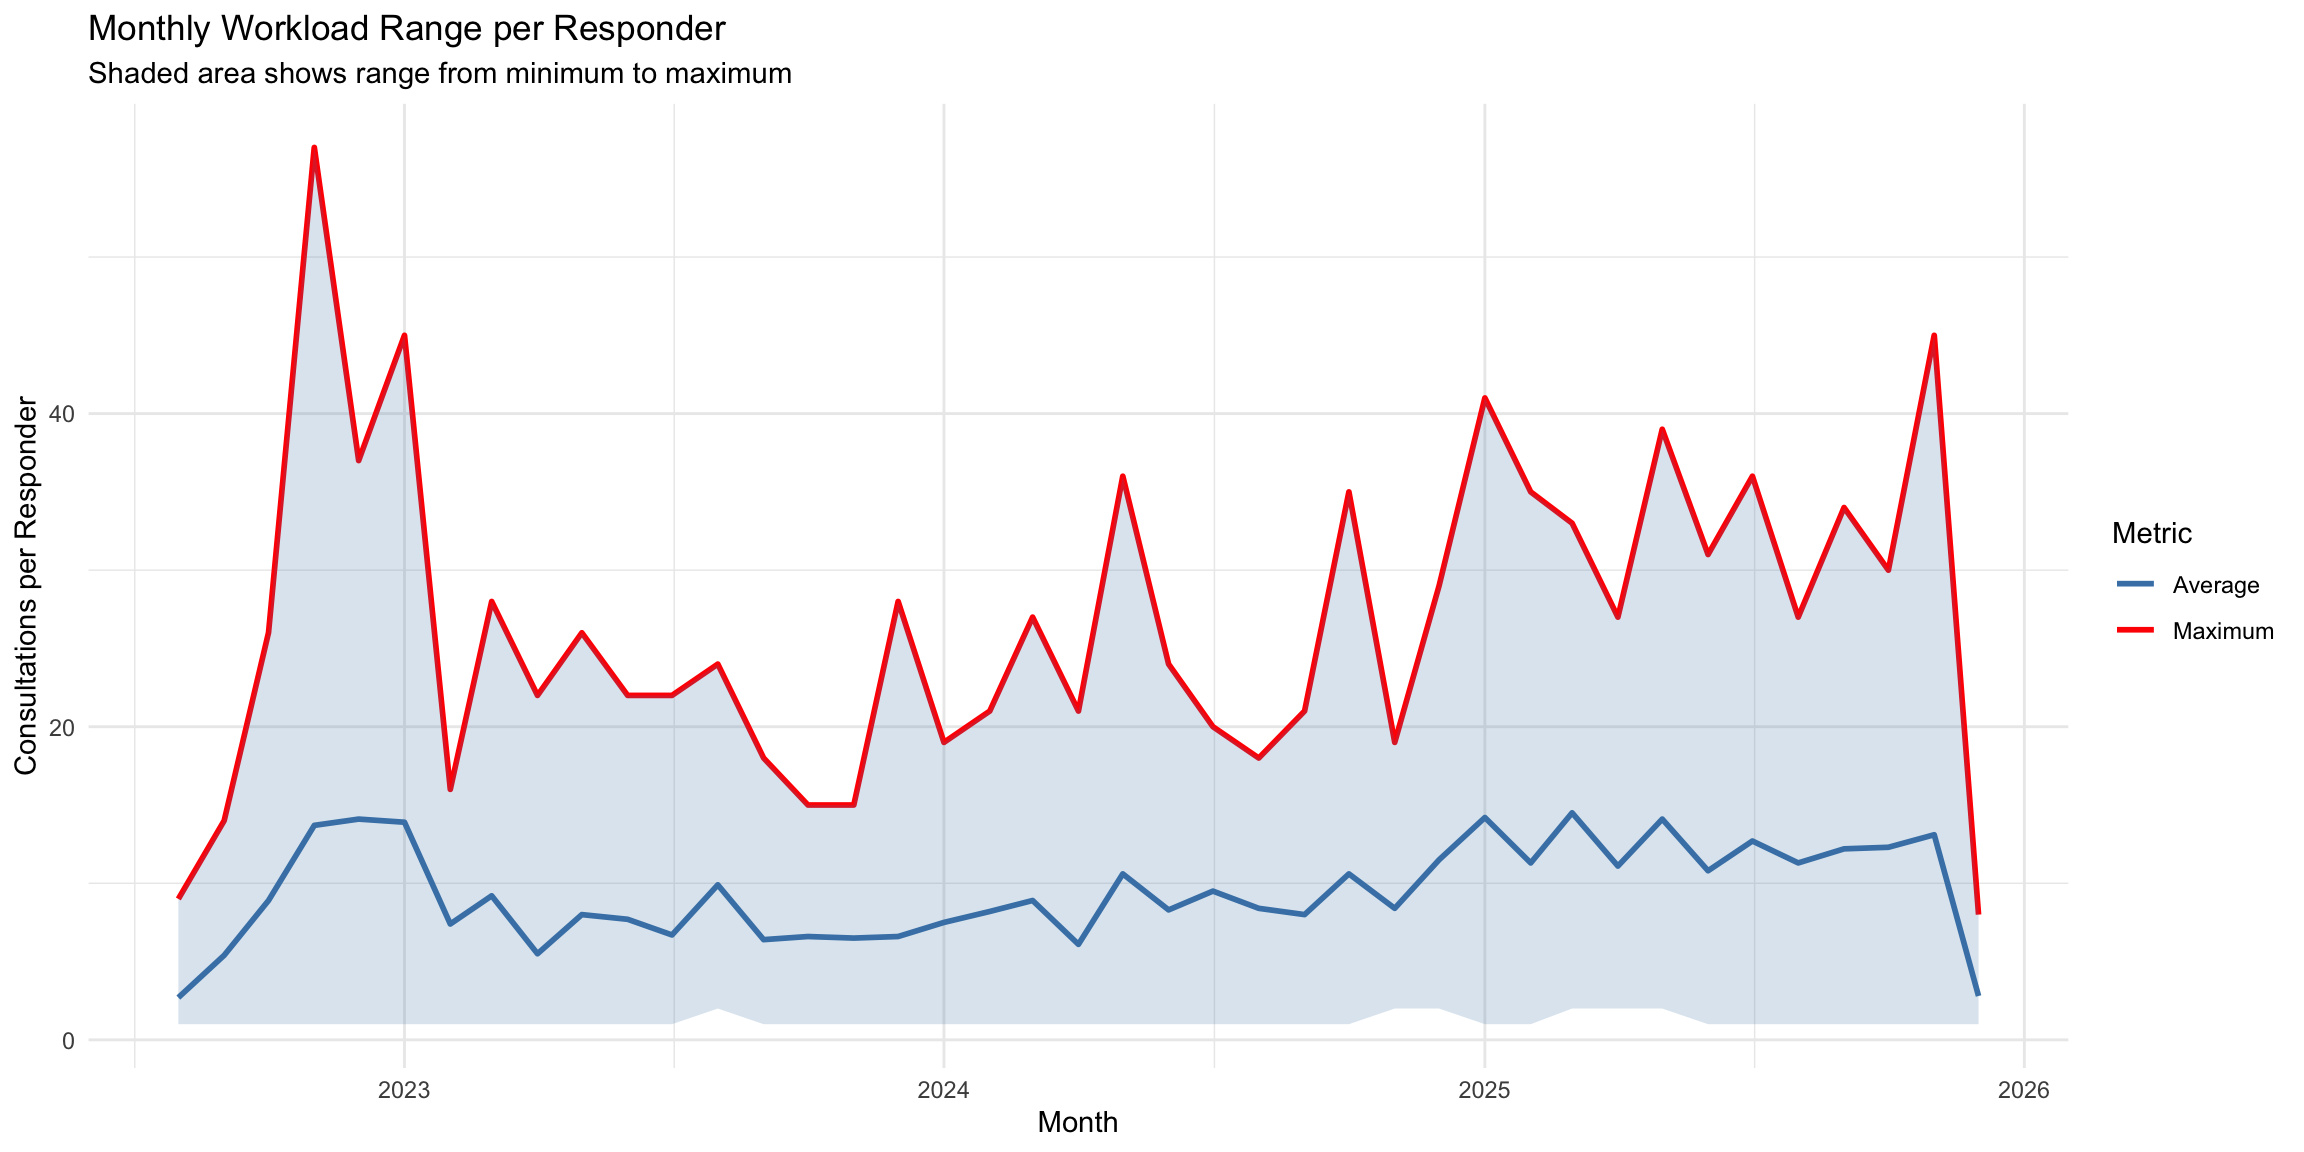
13.4.1 Monthly Workload Trends
| Month | Total_Consultations | Avg_Per_Responder | Max_Per_Responder | Min_Per_Responder | SD |
|---|---|---|---|---|---|
| 2022-08-01 | 27 | 2.7 | 9 | 1 | 2.4 |
| 2022-09-01 | 59 | 5.4 | 14 | 1 | 4.1 |
| 2022-10-01 | 124 | 8.9 | 26 | 1 | 9.0 |
| 2022-11-01 | 192 | 13.7 | 57 | 1 | 17.4 |
| 2022-12-01 | 197 | 14.1 | 37 | 1 | 14.9 |
| 2023-01-01 | 208 | 13.9 | 45 | 1 | 14.9 |
| 2023-02-01 | 96 | 7.4 | 16 | 1 | 5.6 |
| 2023-03-01 | 119 | 9.2 | 28 | 1 | 9.3 |
| 2023-04-01 | 77 | 5.5 | 22 | 1 | 5.7 |
| 2023-05-01 | 96 | 8.0 | 26 | 1 | 8.9 |
| 2023-06-01 | 77 | 7.7 | 22 | 1 | 7.2 |
| 2023-07-01 | 87 | 6.7 | 22 | 1 | 6.5 |
| 2023-08-01 | 119 | 9.9 | 24 | 2 | 8.2 |
| 2023-09-01 | 90 | 6.4 | 18 | 1 | 5.2 |
| 2023-10-01 | 66 | 6.6 | 15 | 1 | 5.0 |
| 2023-11-01 | 85 | 6.5 | 15 | 1 | 5.2 |
| 2023-12-01 | 86 | 6.6 | 28 | 1 | 8.1 |
| 2024-01-01 | 90 | 7.5 | 19 | 1 | 6.9 |
| 2024-02-01 | 123 | 8.2 | 21 | 1 | 6.5 |
| 2024-03-01 | 124 | 8.9 | 27 | 1 | 8.1 |
| 2024-04-01 | 79 | 6.1 | 21 | 1 | 5.2 |
| 2024-05-01 | 159 | 10.6 | 36 | 1 | 9.5 |
| 2024-06-01 | 124 | 8.3 | 24 | 1 | 6.5 |
| 2024-07-01 | 142 | 9.5 | 20 | 1 | 6.9 |
| 2024-08-01 | 118 | 8.4 | 18 | 1 | 6.5 |
| 2024-09-01 | 112 | 8.0 | 21 | 1 | 6.7 |
| 2024-10-01 | 169 | 10.6 | 35 | 1 | 9.0 |
| 2024-11-01 | 117 | 8.4 | 19 | 2 | 5.7 |
| 2024-12-01 | 161 | 11.5 | 29 | 2 | 8.1 |
| 2025-01-01 | 241 | 14.2 | 41 | 1 | 11.4 |
| 2025-02-01 | 203 | 11.3 | 35 | 1 | 10.6 |
| 2025-03-01 | 261 | 14.5 | 33 | 2 | 10.0 |
| 2025-04-01 | 199 | 11.1 | 27 | 2 | 7.8 |
| 2025-05-01 | 240 | 14.1 | 39 | 2 | 11.2 |
| 2025-06-01 | 195 | 10.8 | 31 | 1 | 8.9 |
| 2025-07-01 | 228 | 12.7 | 36 | 1 | 11.3 |
| 2025-08-01 | 192 | 11.3 | 27 | 1 | 8.4 |
| 2025-09-01 | 231 | 12.2 | 34 | 1 | 10.6 |
| 2025-10-01 | 234 | 12.3 | 30 | 1 | 8.4 |
| 2025-11-01 | 288 | 13.1 | 45 | 1 | 12.1 |
| 2025-12-01 | 47 | 2.8 | 8 | 1 | 1.9 |
13.4.2 Peak Workload Identification
| Pathologist | As_Asker | As_Responder | Total | Balance | Pct_Asker | Pct_Responder |
|---|---|---|---|---|---|---|
| P8 | 754 | 348 | 1102 | -406 | 68.4 | 31.6 |
| P2 | 275 | 684 | 959 | 409 | 28.7 | 71.3 |
| P5 | 176 | 751 | 927 | 575 | 19.0 | 81.0 |
| P9 | 194 | 696 | 890 | 502 | 21.8 | 78.2 |
| P13 | 684 | 68 | 752 | -616 | 91.0 | 9.0 |
| P11 | 171 | 522 | 693 | 351 | 24.7 | 75.3 |
| P10 | 434 | 216 | 650 | -218 | 66.8 | 33.2 |
| P21 | 197 | 399 | 596 | 202 | 33.1 | 66.9 |
| P17 | 207 | 362 | 569 | 155 | 36.4 | 63.6 |
13.4.3 Underutilized Capacity
| Pathologist | As_Asker | As_Responder | Total | Balance | Pct_Asker | Pct_Responder |
|---|---|---|---|---|---|---|
| NA | 4 | 0 | 4 | -4 | 100.0 | 0.0 |
| P20 | 3 | 2 | 5 | -1 | 60.0 | 40.0 |
| P12 | 8 | 1 | 9 | -7 | 88.9 | 11.1 |
| P31 | 17 | 0 | 17 | -17 | 100.0 | 0.0 |
| P32 | 12 | 8 | 20 | -4 | 60.0 | 40.0 |
| P30 | 11 | 18 | 29 | 7 | 37.9 | 62.1 |
| P15 | 37 | 1 | 38 | -36 | 97.4 | 2.6 |
| P26 | 50 | 6 | 56 | -44 | 89.3 | 10.7 |
| P25 | 56 | 17 | 73 | -39 | 76.7 | 23.3 |
13.5 Concurrent Consultations
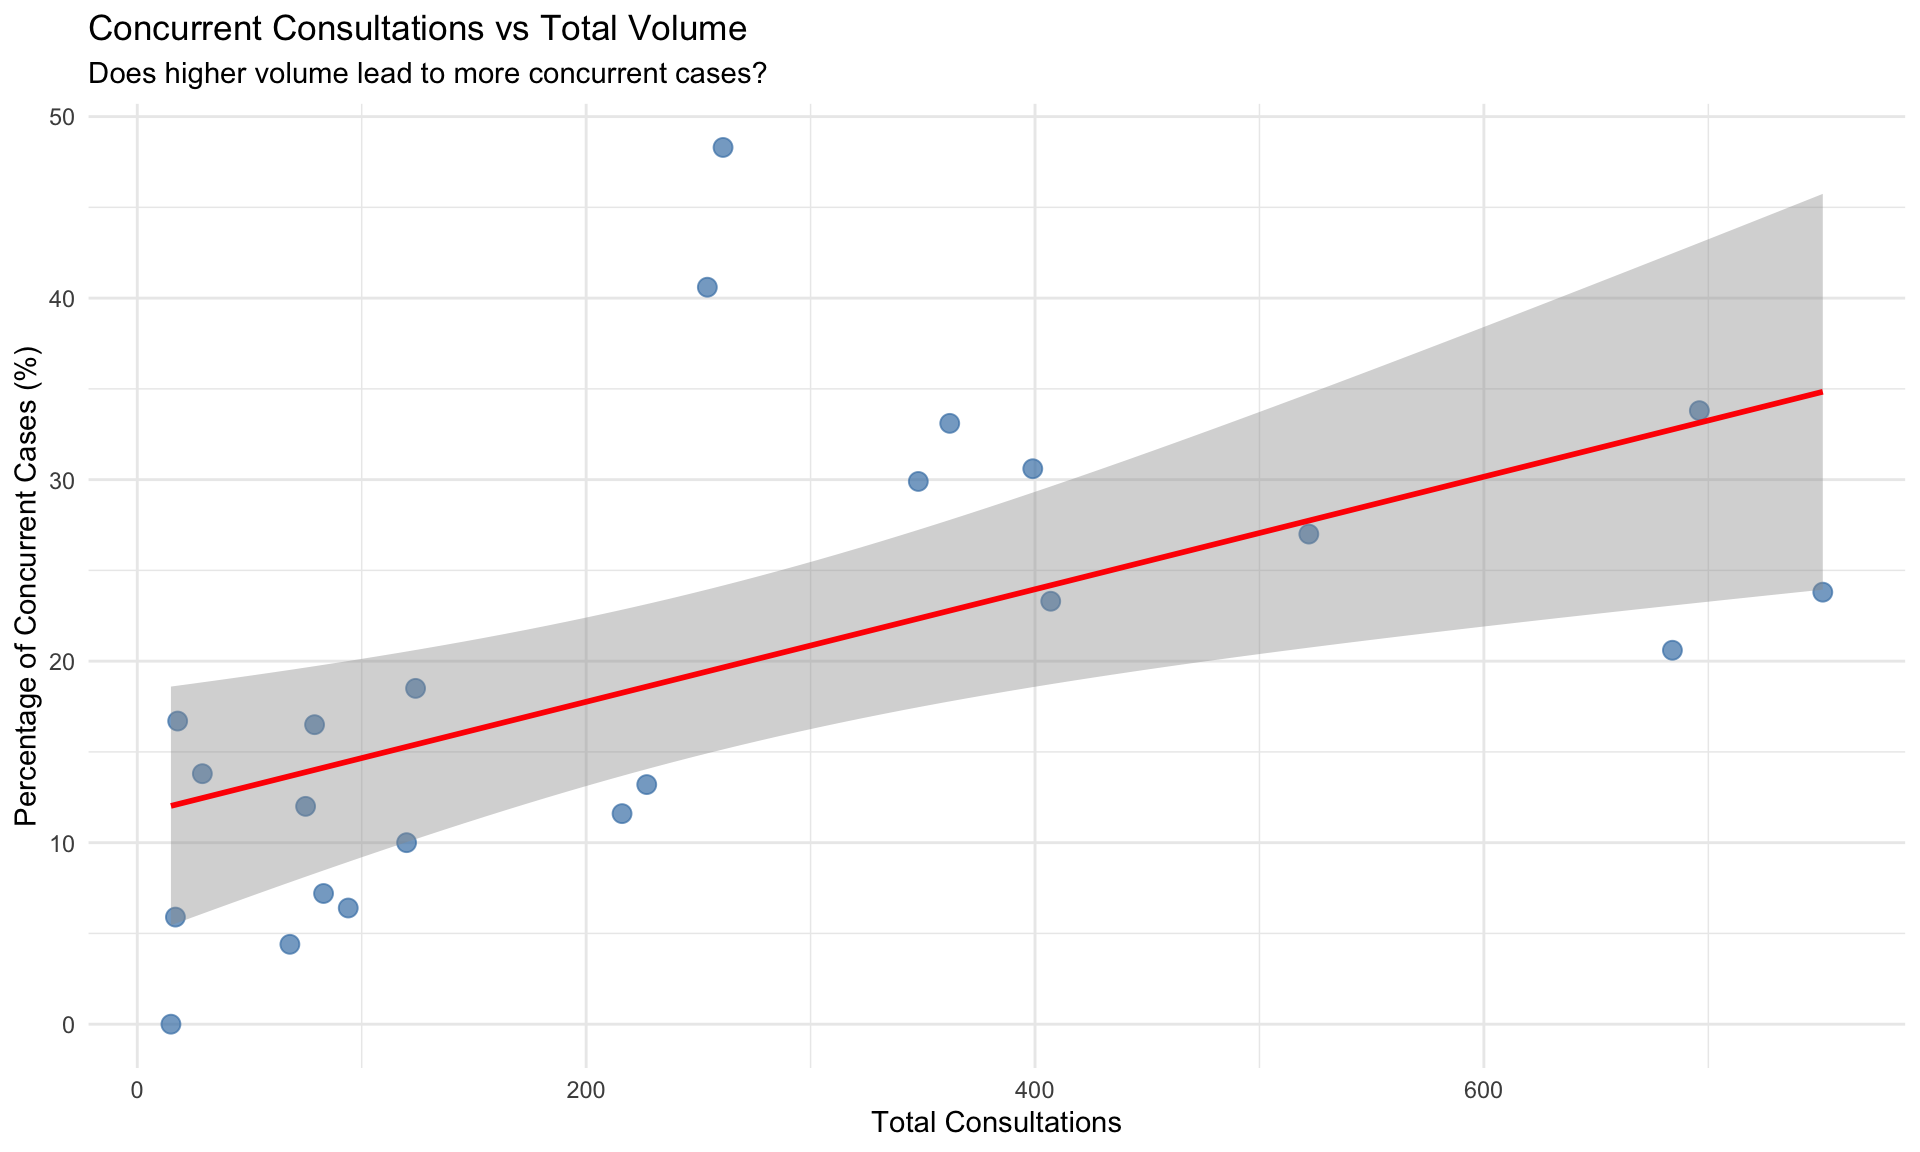
Analysis of overlapping consultation requests:
| Responder | Total_Consultations | Concurrent_Cases | Pct_Concurrent |
|---|---|---|---|
| P33 | 261 | 126 | 48.3 |
| P6 | 254 | 103 | 40.6 |
| P9 | 696 | 235 | 33.8 |
| P17 | 362 | 120 | 33.1 |
| P21 | 399 | 122 | 30.6 |
| P8 | 348 | 104 | 29.9 |
| P11 | 522 | 141 | 27.0 |
| P5 | 751 | 179 | 23.8 |
| P23 | 407 | 95 | 23.3 |
| P2 | 684 | 141 | 20.6 |
| P28 | 124 | 23 | 18.5 |
| P30 | 18 | 3 | 16.7 |
| P4 | 79 | 13 | 16.5 |
| P1 | 29 | 4 | 13.8 |
| P19 | 227 | 30 | 13.2 |
| P16 | 75 | 9 | 12.0 |
| P10 | 216 | 25 | 11.6 |
| P24 | 120 | 12 | 10.0 |
| P18 | 83 | 6 | 7.2 |
| P27 | 94 | 6 | 6.4 |
| P25 | 17 | 1 | 5.9 |
| P13 | 68 | 3 | 4.4 |
| P3 | 15 | 0 | 0.0 |
13.6 Workload Efficiency
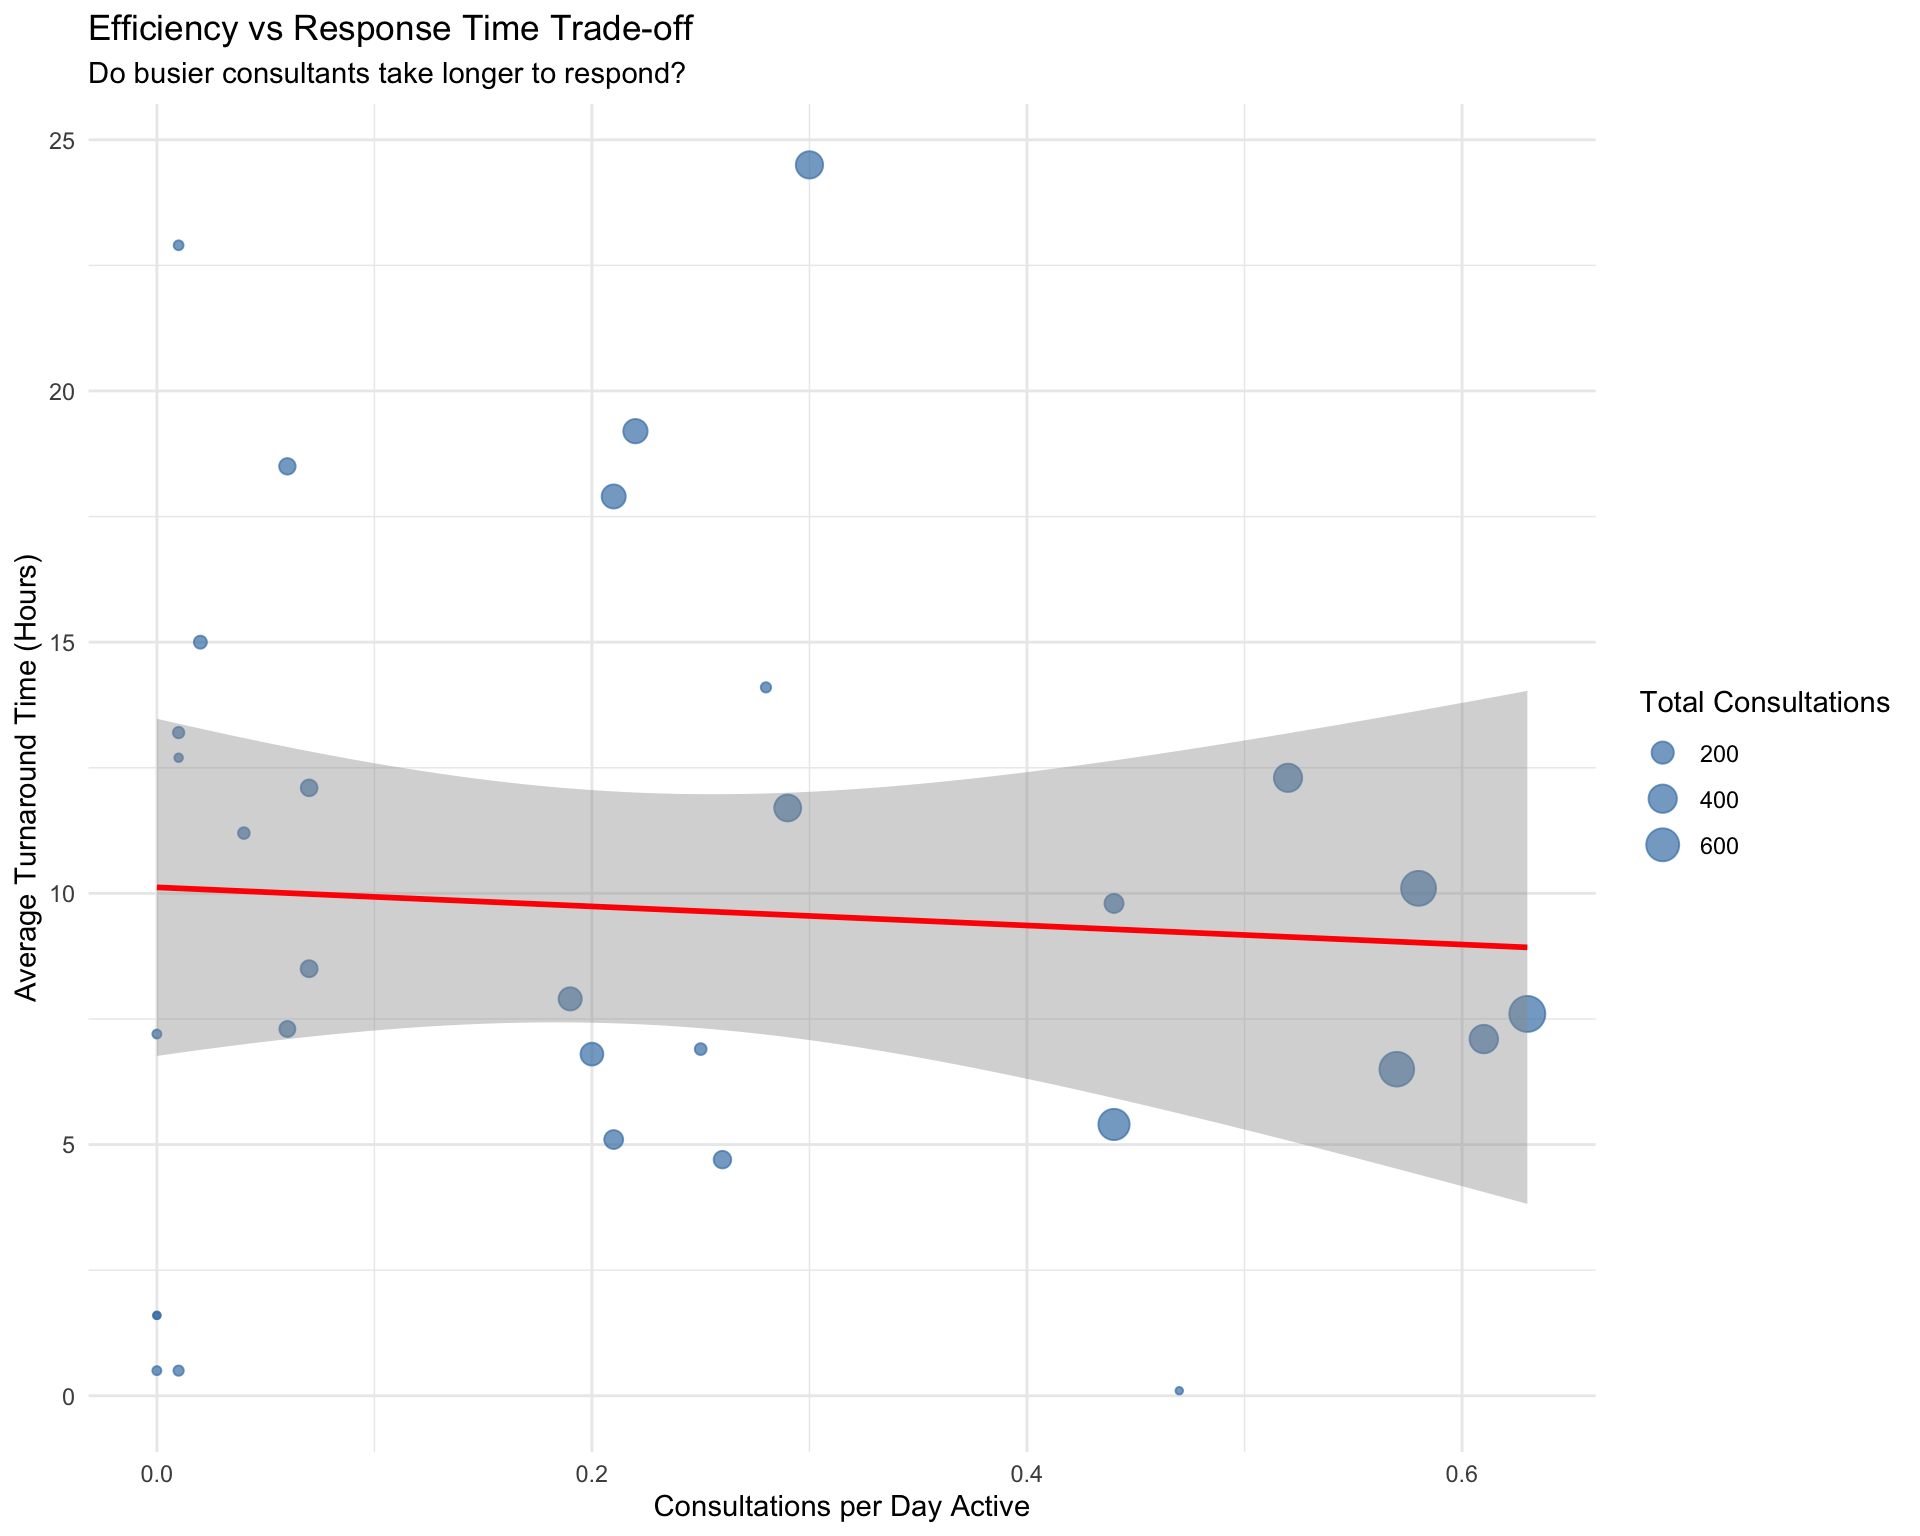
13.6.1 Response Rate (Consultations per Day Active)
| Responder | N_Consultations | Days_Active | Consultations_Per_Day | Avg_TAT | Consults_Per_Working_Day_2025 |
|---|---|---|---|---|---|
| P5 | 751 | 1197.139259 | 0.63 | 7.6 | NA |
| P23 | 407 | 670.655764 | 0.61 | 7.1 | NA |
| P9 | 696 | 1200.931343 | 0.58 | 10.1 | NA |
| P2 | 684 | 1199.252847 | 0.57 | 6.5 | NA |
| P21 | 399 | 765.151690 | 0.52 | 12.3 | NA |
| P29 | 1 | 2.127407 | 0.47 | 0.1 | NA |
| P11 | 522 | 1198.734416 | 0.44 | 5.4 | NA |
| P28 | 124 | 281.029120 | 0.44 | 9.8 | NA |
| P17 | 362 | 1200.777251 | 0.30 | 24.5 | NA |
| P8 | 348 | 1180.121632 | 0.29 | 11.7 | NA |
| P32 | 8 | 28.114259 | 0.28 | 14.1 | NA |
| P27 | 94 | 357.735995 | 0.26 | 4.7 | NA |
| P30 | 18 | 71.119340 | 0.25 | 6.9 | NA |
| P33 | 261 | 1200.705382 | 0.22 | 19.2 | NA |
| P24 | 120 | 582.123588 | 0.21 | 5.1 | NA |
| P6 | 254 | 1200.570822 | 0.21 | 17.9 | NA |
| P10 | 216 | 1087.039803 | 0.20 | 6.8 | NA |
| P19 | 227 | 1200.040995 | 0.19 | 7.9 | NA |
| P18 | 83 | 1149.354051 | 0.07 | 8.5 | NA |
| P4 | 79 | 1131.476562 | 0.07 | 12.1 | NA |
| P13 | 68 | 1149.716238 | 0.06 | 7.3 | NA |
| P16 | 75 | 1197.220116 | 0.06 | 18.5 | NA |
| P25 | 17 | 440.911539 | 0.04 | 11.2 | NA |
| P1 | 29 | 1201.474404 | 0.02 | 15.0 | NA |
| P14 | 8 | 1068.070081 | 0.01 | 0.5 | NA |
| P20 | 2 | 328.976076 | 0.01 | 12.7 | NA |
| P26 | 6 | 513.996644 | 0.01 | 22.9 | NA |
| P3 | 15 | 1149.380706 | 0.01 | 13.2 | NA |
| P12 | 1 | 1113.262540 | 0.00 | 1.6 | NA |
| P15 | 1 | 1067.252679 | 0.00 | 1.6 | NA |
| P22 | 3 | 674.053790 | 0.00 | 0.5 | NA |
| P7 | 3 | 1149.716238 | 0.00 | 7.2 | NA |
13.6.2 Total Workload Context
Comparison of Consultation Load vs Routine Biopsy/Cytology Workload.
13.6.2.1 Per-Month Breakdown
| Month | N Pathologists | Avg Biopsy/Cyto | Avg Total Score | Total Consults | Avg Consults | Avg Working Days |
|---|---|---|---|---|---|---|
| Jan 2025 | 20 | 190.3 | 1535.2 | 277 | 13.8 | 21.1 |
| Feb 2025 | 20 | 179.8 | 1498.0 | 261 | 13.1 | 21.2 |
| Mar 2025 | 20 | 183.1 | 1515.0 | 248 | 12.4 | 21.1 |
| Apr 2025 | 20 | 184.6 | 1524.1 | 203 | 10.2 | 21.5 |
| May 2025 | 20 | 212.9 | 1706.2 | 258 | 12.9 | 21.1 |
| Jun 2025 | 20 | 165.4 | 1499.5 | 218 | 10.9 | 20.0 |
| Jul 2025 | 21 | 177.4 | 1597.7 | 275 | 13.1 | 22.0 |
| Aug 2025 | 21 | 160.9 | 1411.2 | 218 | 10.4 | 22.0 |
| Sep 2025 | 22 | 159.7 | 1413.0 | 258 | 11.7 | 22.0 |
| Oct 2025 | 24 | 157.9 | 1426.9 | 263 | 11.0 | 22.0 |
| Nov 2025 | 25 | 158.9 | 1437.8 | 309 | 12.4 | 22.0 |
| Dec 2025 | 25 | 178.3 | 1627.0 | 348 | 13.9 | 22.0 |
13.6.3 Efficiency vs Quality Trade-off
Does handling more consultations per day come at the cost of slower responses? The scatter plot below examines this question. A positive slope would suggest that higher throughput is associated with longer turnaround times (a capacity constraint), while a flat or negative slope would indicate that busier responders maintain — or even improve — their response speed, possibly due to greater experience or more streamlined workflows.
13.7 Category Workload Profile
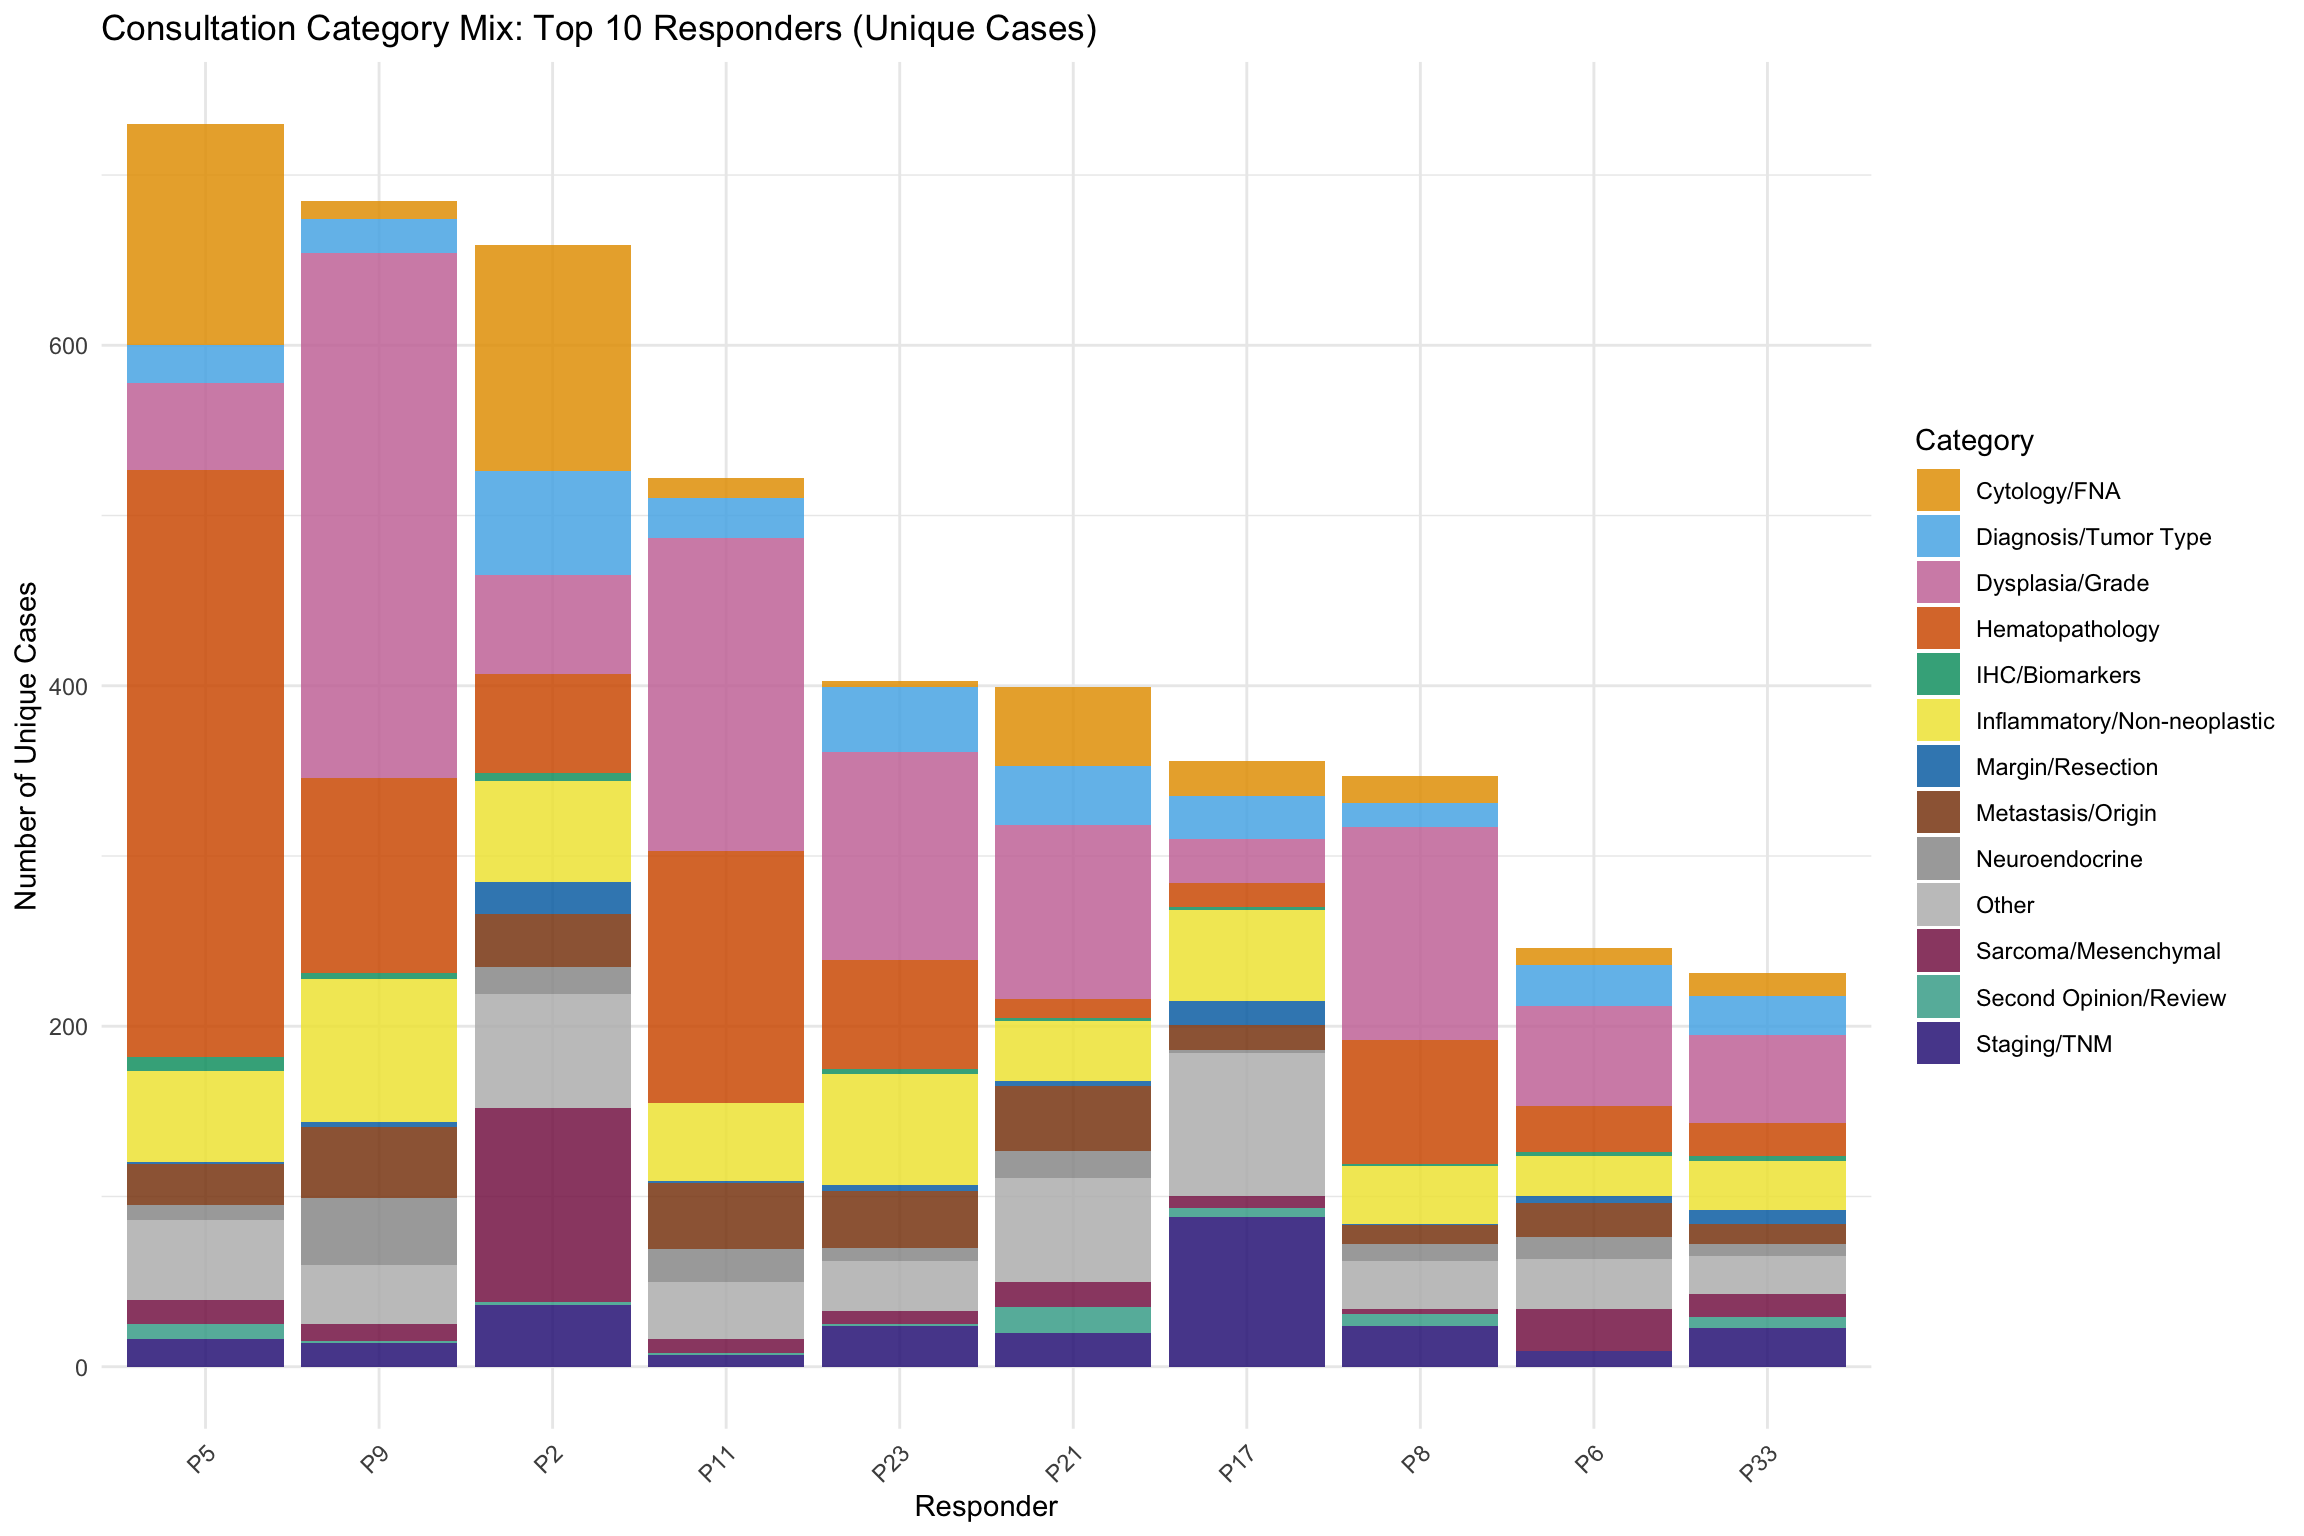
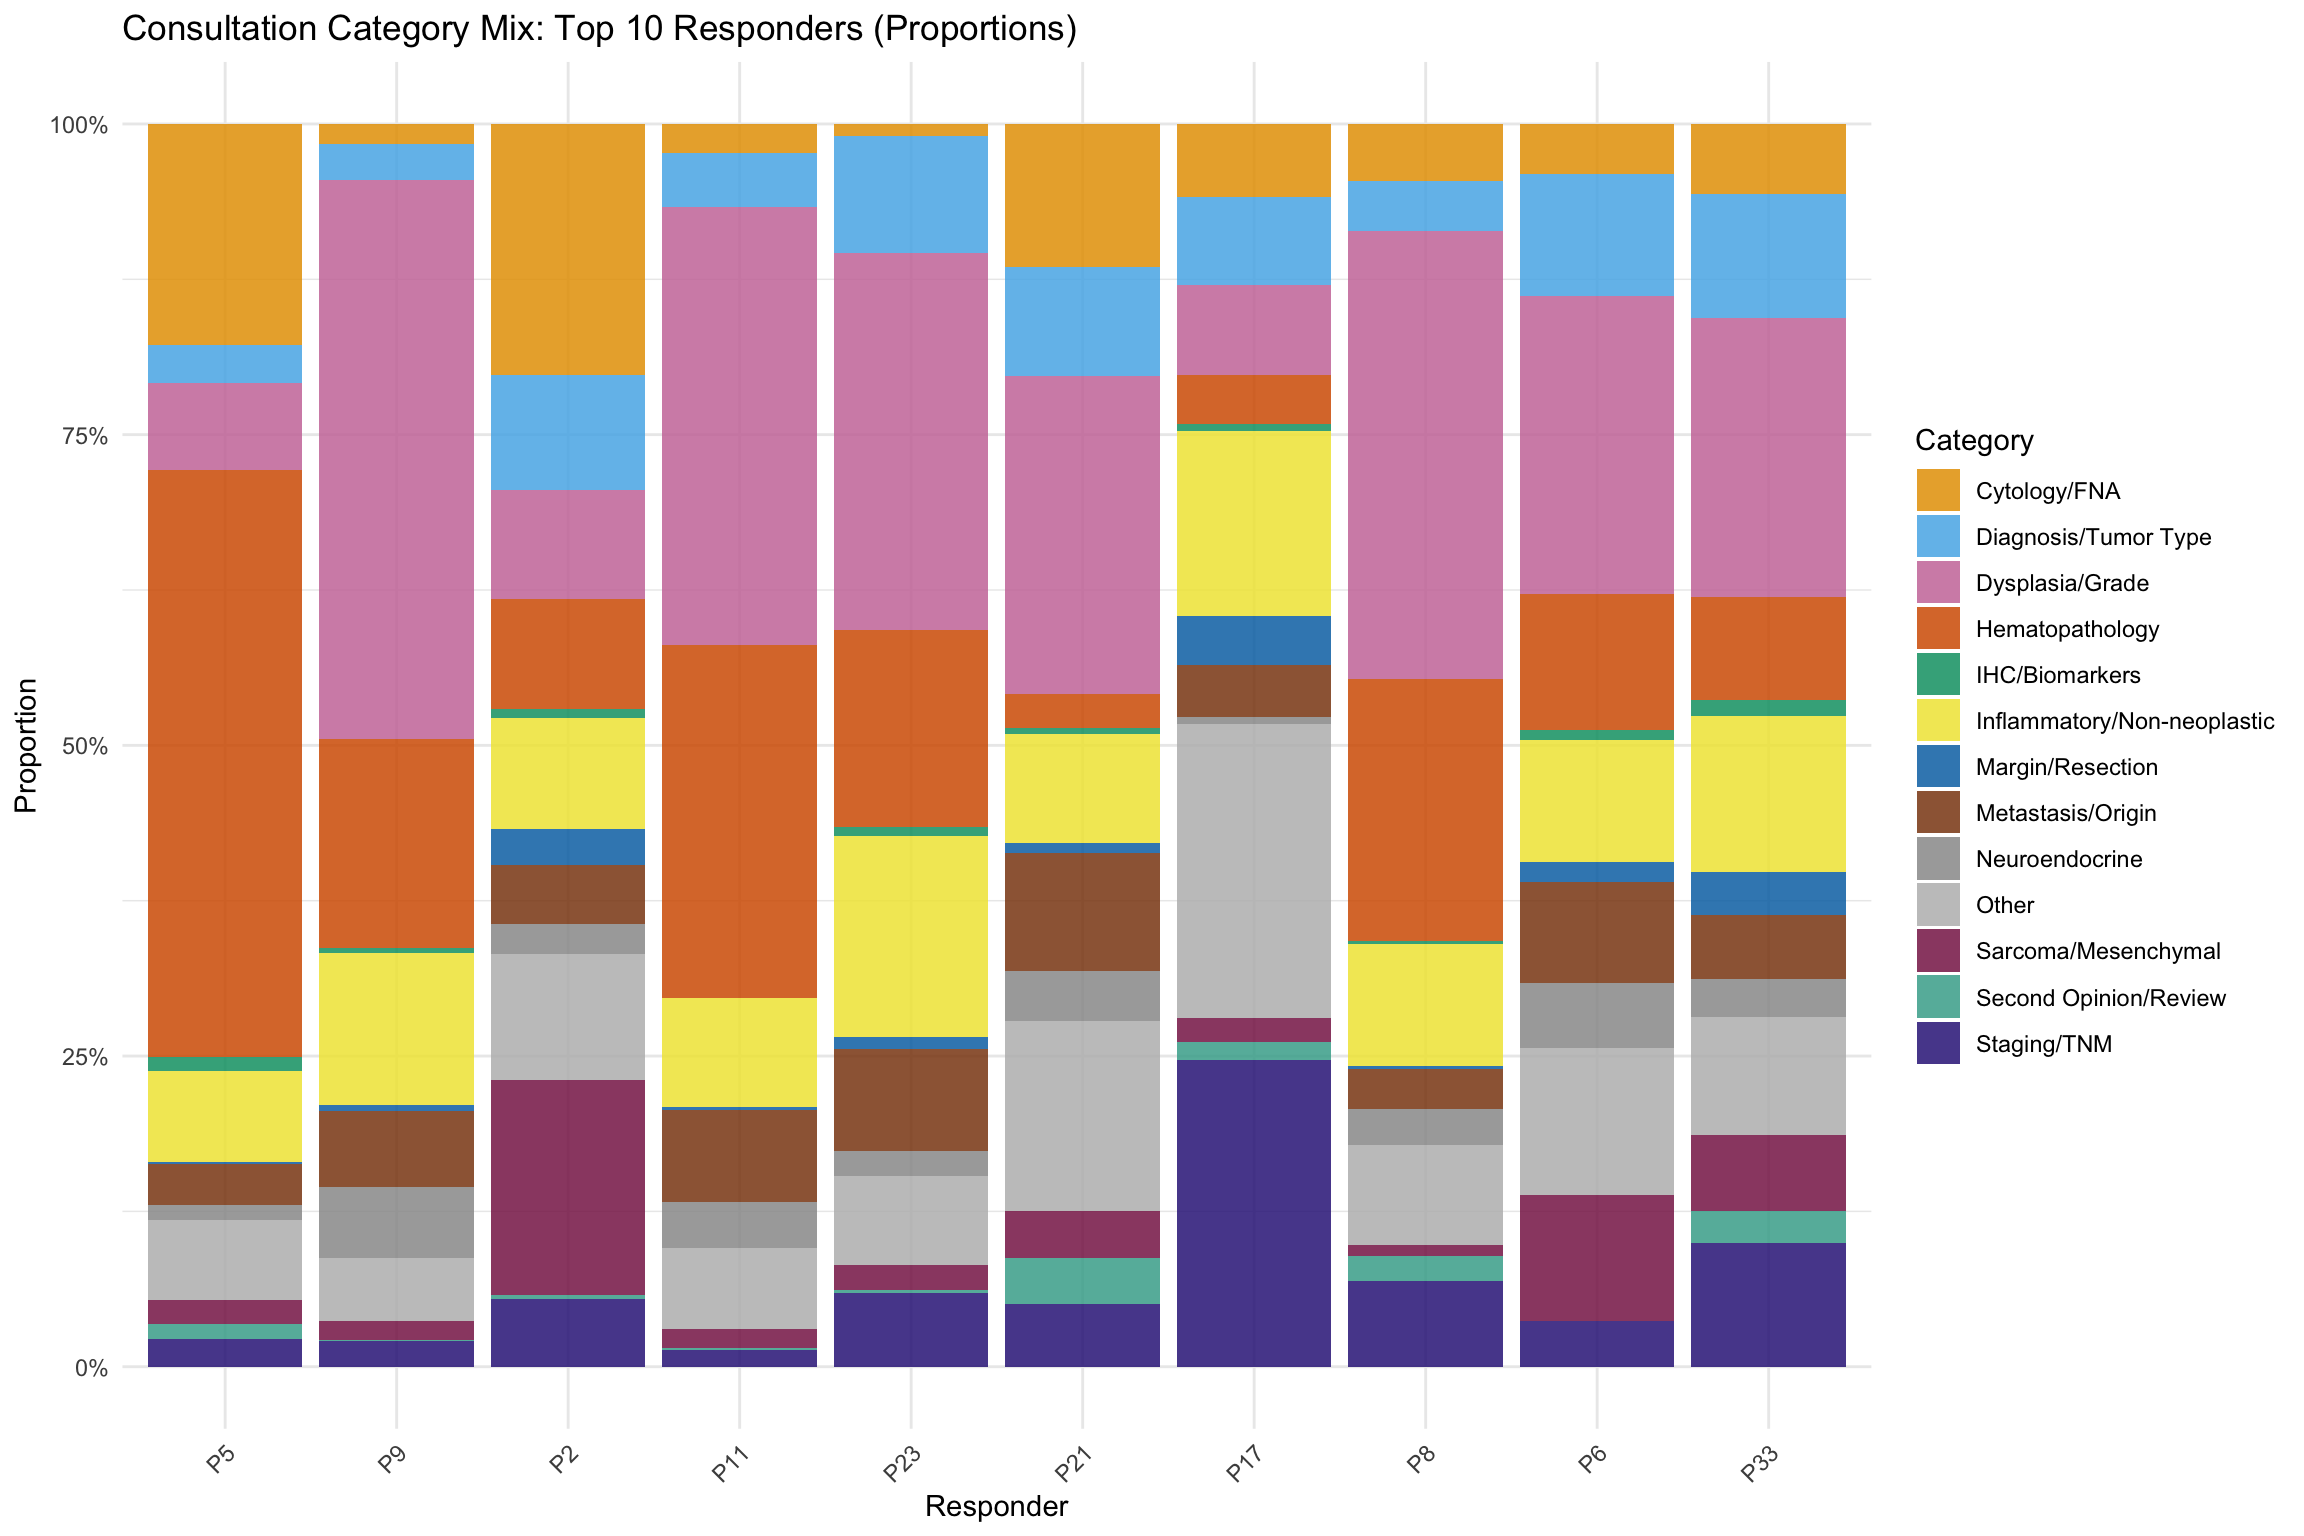
How does the consultation category mix vary across pathologists? This section profiles the top 10 responders by their category distributions.
13.7.1 Category Complexity Proxy
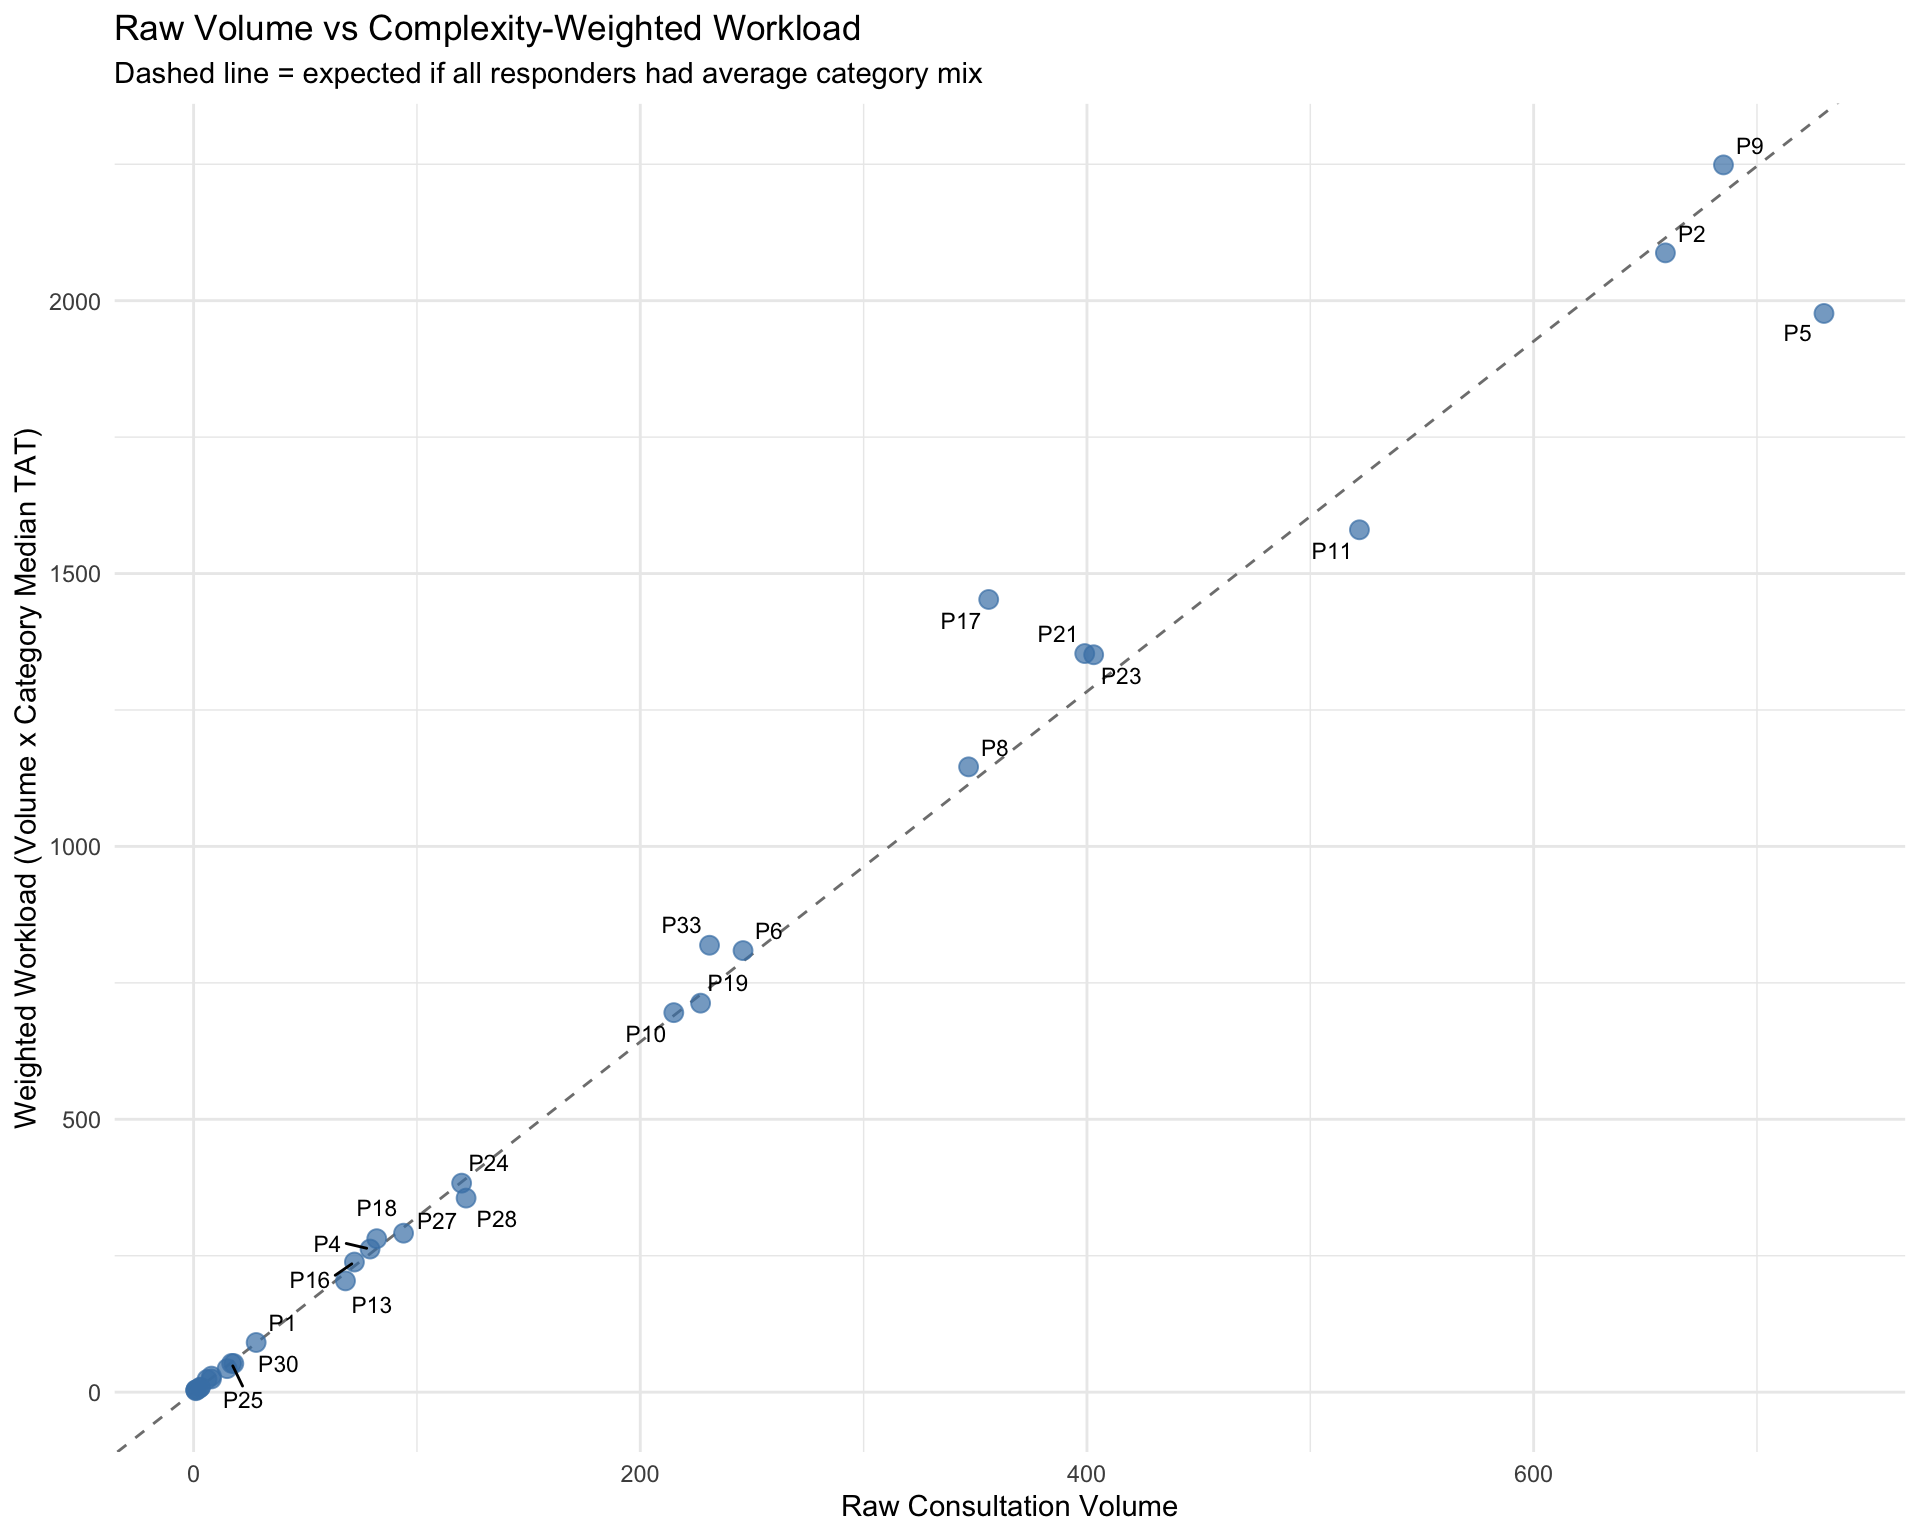
Using median turnaround time per category as a proxy for diagnostic complexity, we can compute a complexity-weighted workload score for each responder.
| Category | Median TAT (Hours) | Unique Cases | Consultations |
|---|---|---|---|
| IHC/Biomarkers | 7.6 | 28 | 38 |
| Staging/TNM | 5.9 | 230 | 318 |
| Margin/Resection | 4.6 | 58 | 75 |
| Neuroendocrine | 4.3 | 136 | 192 |
| Inflammatory/Non-neoplastic | 3.9 | 447 | 578 |
| Other | 3.9 | 449 | 549 |
| Dysplasia/Grade | 3.4 | 1022 | 1385 |
| Diagnosis/Tumor Type | 2.8 | 310 | 391 |
| Second Opinion/Review | 2.8 | 53 | 69 |
| Cytology/FNA | 2.6 | 423 | 493 |
| Metastasis/Origin | 2.6 | 335 | 458 |
| Sarcoma/Mesenchymal | 2.4 | 214 | 296 |
| Hematopathology | 2.0 | 827 | 1040 |
13.7.2 Category-Specific Efficiency
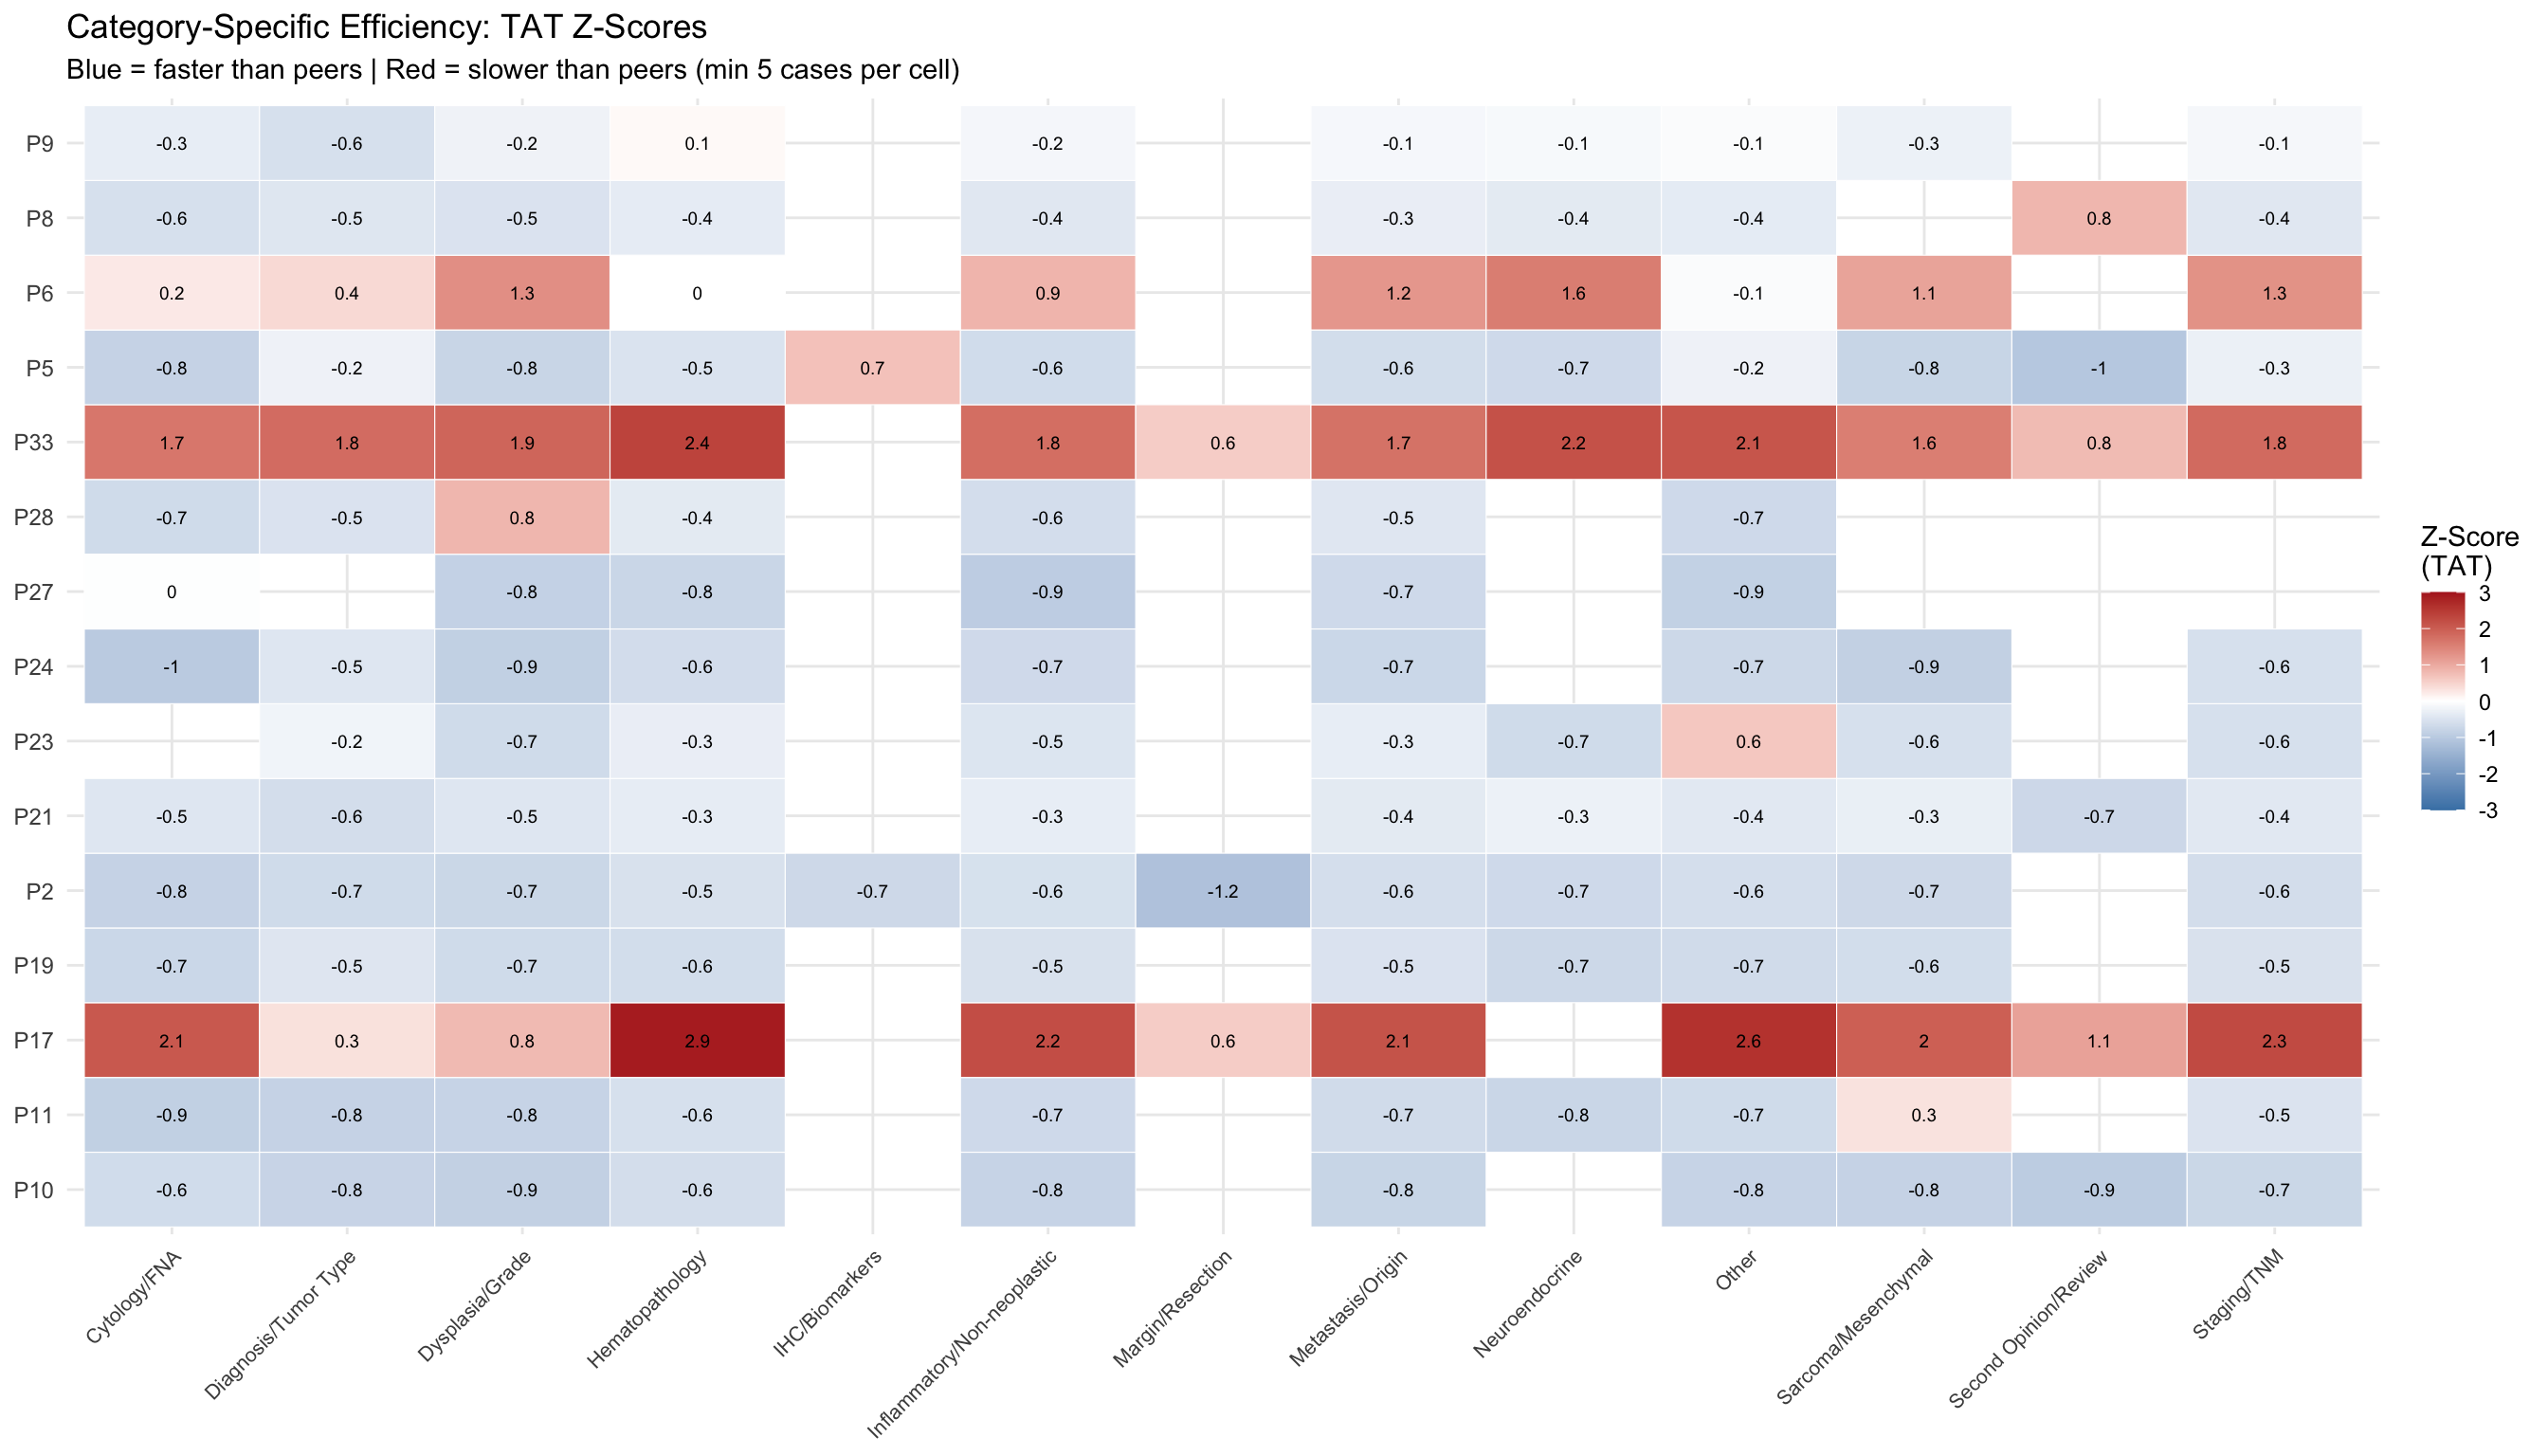
This heatmap shows how each responder’s turnaround time compares to peers within the same category. Blue cells indicate faster-than-average performance; red cells indicate slower.
13.8 Employment Timeline
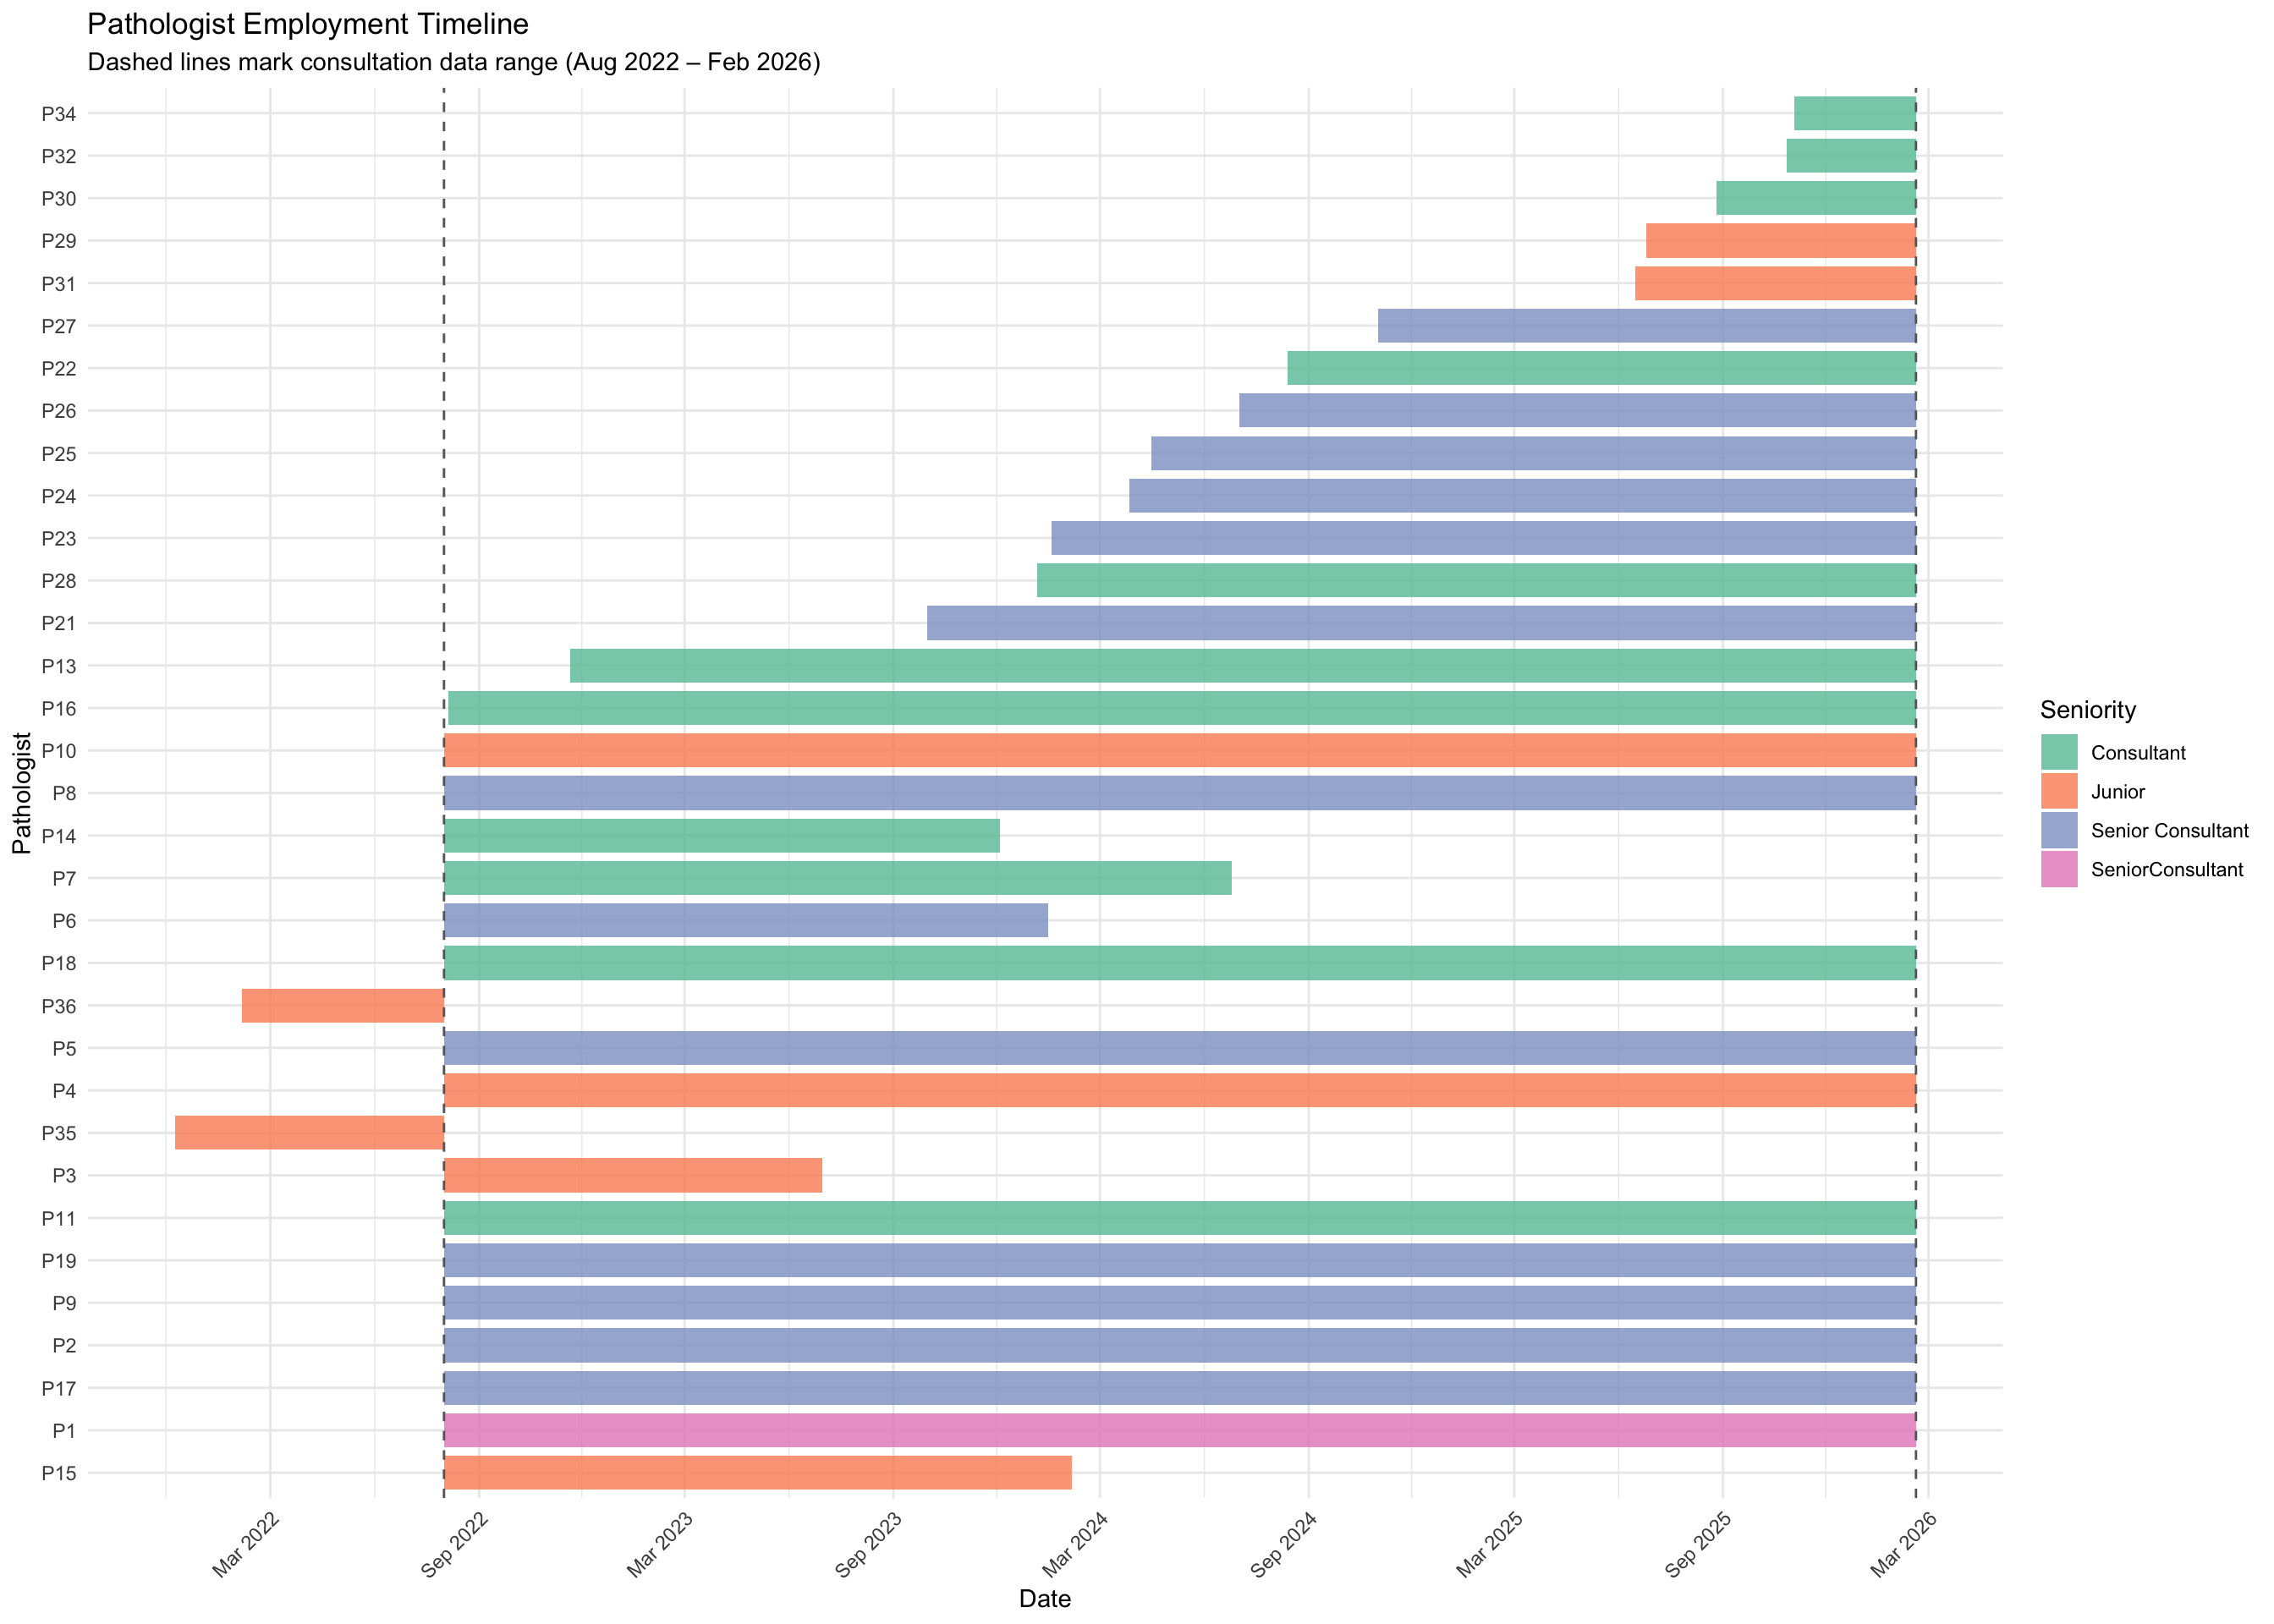
Gantt-style visualization showing each pathologist’s active period in the department.
13.9 Adjusted Workload Metrics (2025)
Consultation rate per working day (accounting for leave), not just calendar days.
| Pathologist | Months | Working Days | Leave Days | Total Score | Score/Day | Consults (WL) | Consults/Day |
|---|---|---|---|---|---|---|---|
| P5 | 12 | 258 | 6 | 24684.2 | 95.7 | 404 | 1.57 |
| P17 | 12 | 258 | 6 | 23507.0 | 91.1 | 146 | 0.57 |
| P28 | 12 | 259 | 5 | 22874.8 | 88.3 | 157 | 0.61 |
| P22 | 12 | 264 | 0 | 22838.3 | 86.5 | 4 | 0.02 |
| P10 | 12 | 259 | 5 | 21999.2 | 84.9 | 144 | 0.56 |
| P23 | 12 | 258 | 6 | 20443.9 | 79.2 | 308 | 1.19 |
| P21 | 12 | 256 | 8 | 19601.6 | 76.6 | 320 | 1.25 |
| P13 | 12 | 261 | 3 | 19990.1 | 76.6 | 52 | 0.20 |
| P2 | 12 | 260 | 4 | 19719.9 | 75.8 | 257 | 0.99 |
| P29 | 6 | 132 | 0 | 9386.0 | 71.1 | 20 | 0.15 |
| P25 | 12 | 259 | 5 | 18399.6 | 71.0 | 16 | 0.06 |
| P27 | 12 | 252 | 12 | 17137.5 | 68.0 | 91 | 0.36 |
| P4 | 12 | 264 | 0 | 17517.5 | 66.4 | 89 | 0.34 |
| P9 | 12 | 255 | 9 | 16685.4 | 65.4 | 221 | 0.87 |
| P8 | 12 | 261 | 3 | 16825.5 | 64.5 | 195 | 0.75 |
| P19 | 12 | 251 | 13 | 16125.0 | 64.2 | 83 | 0.33 |
| P30 | 4 | 88 | 0 | 5621.7 | 63.9 | 24 | 0.27 |
| P18 | 12 | 262 | 2 | 16696.0 | 63.7 | 39 | 0.15 |
| P24 | 12 | 254 | 10 | 16111.5 | 63.4 | 89 | 0.35 |
| P11 | 12 | 256 | 8 | 14064.7 | 54.9 | 416 | 1.62 |
| P26 | 12 | 257 | 7 | 13419.1 | 52.2 | 2 | 0.01 |
| P32 | 3 | 66 | 0 | 3250.9 | 49.3 | 19 | 0.29 |
| P16 | 12 | 256 | 8 | 11111.0 | 43.4 | 40 | 0.16 |
| P34 | 2 | 44 | 0 | 1252.0 | 28.5 | 0 | 0.00 |
| P31 | 3 | 66 | 0 | 1439.0 | 21.8 | 0 | 0.00 |
13.10 Monthly Workload Heatmap
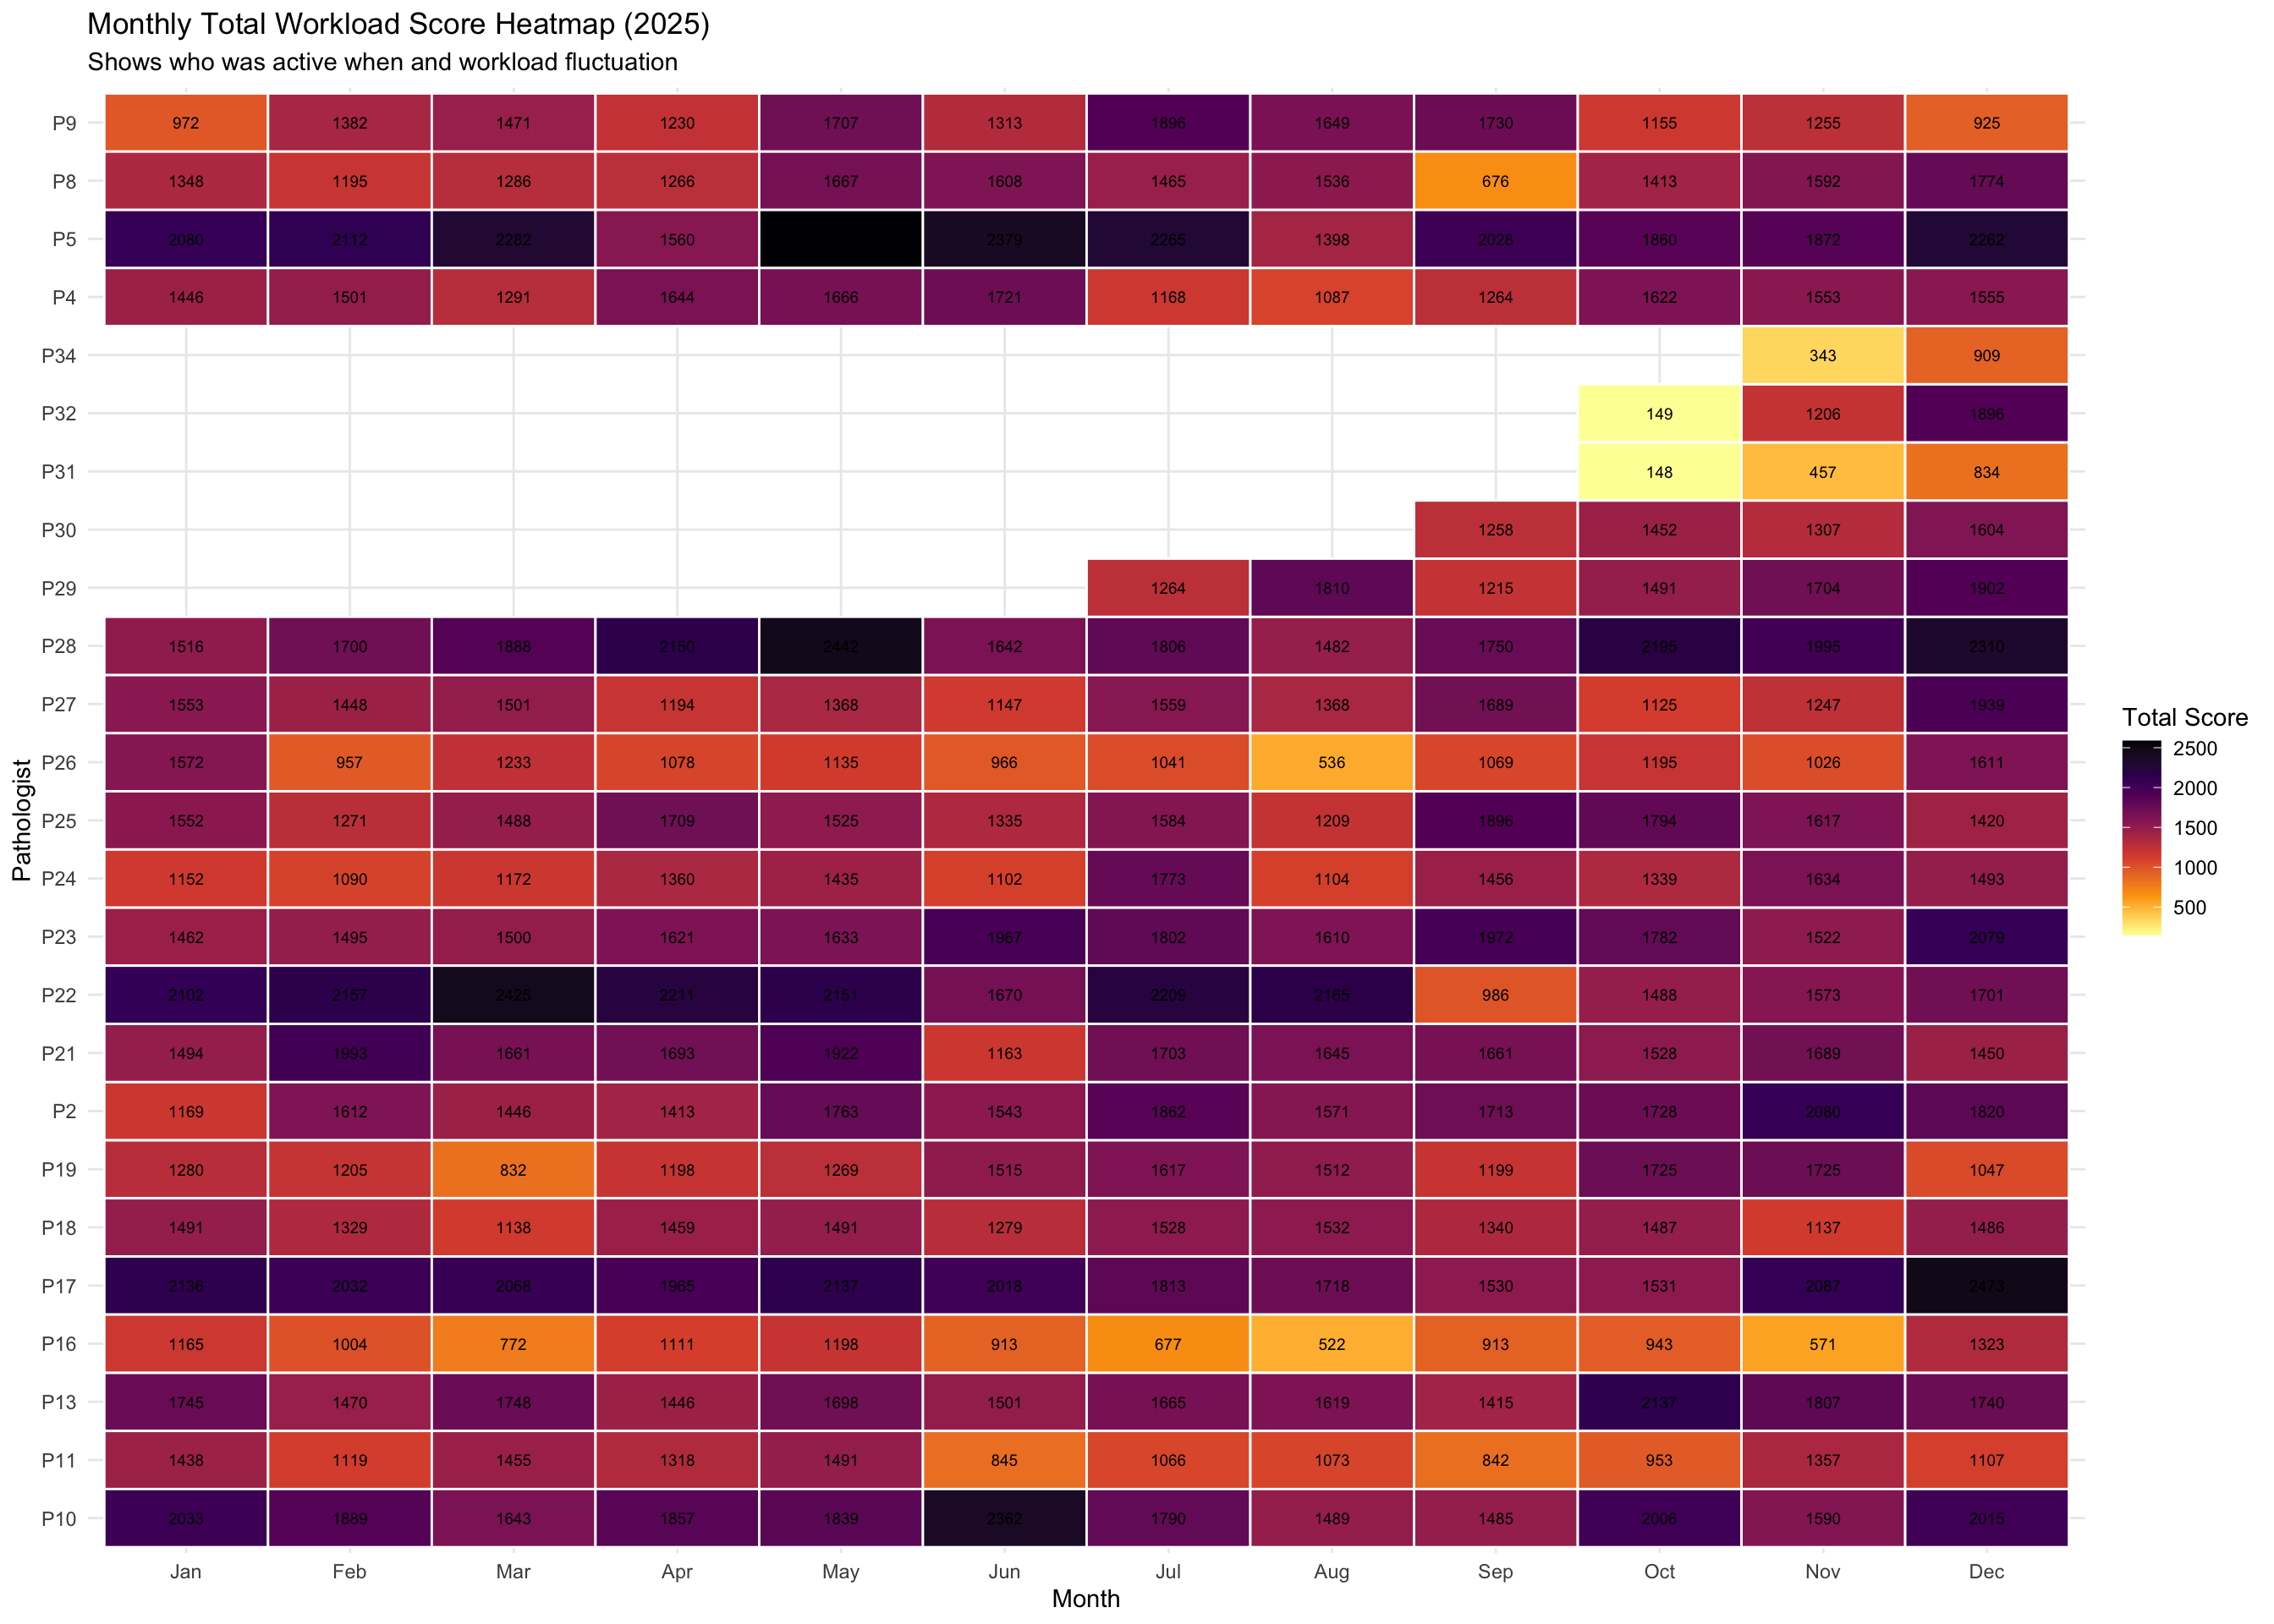
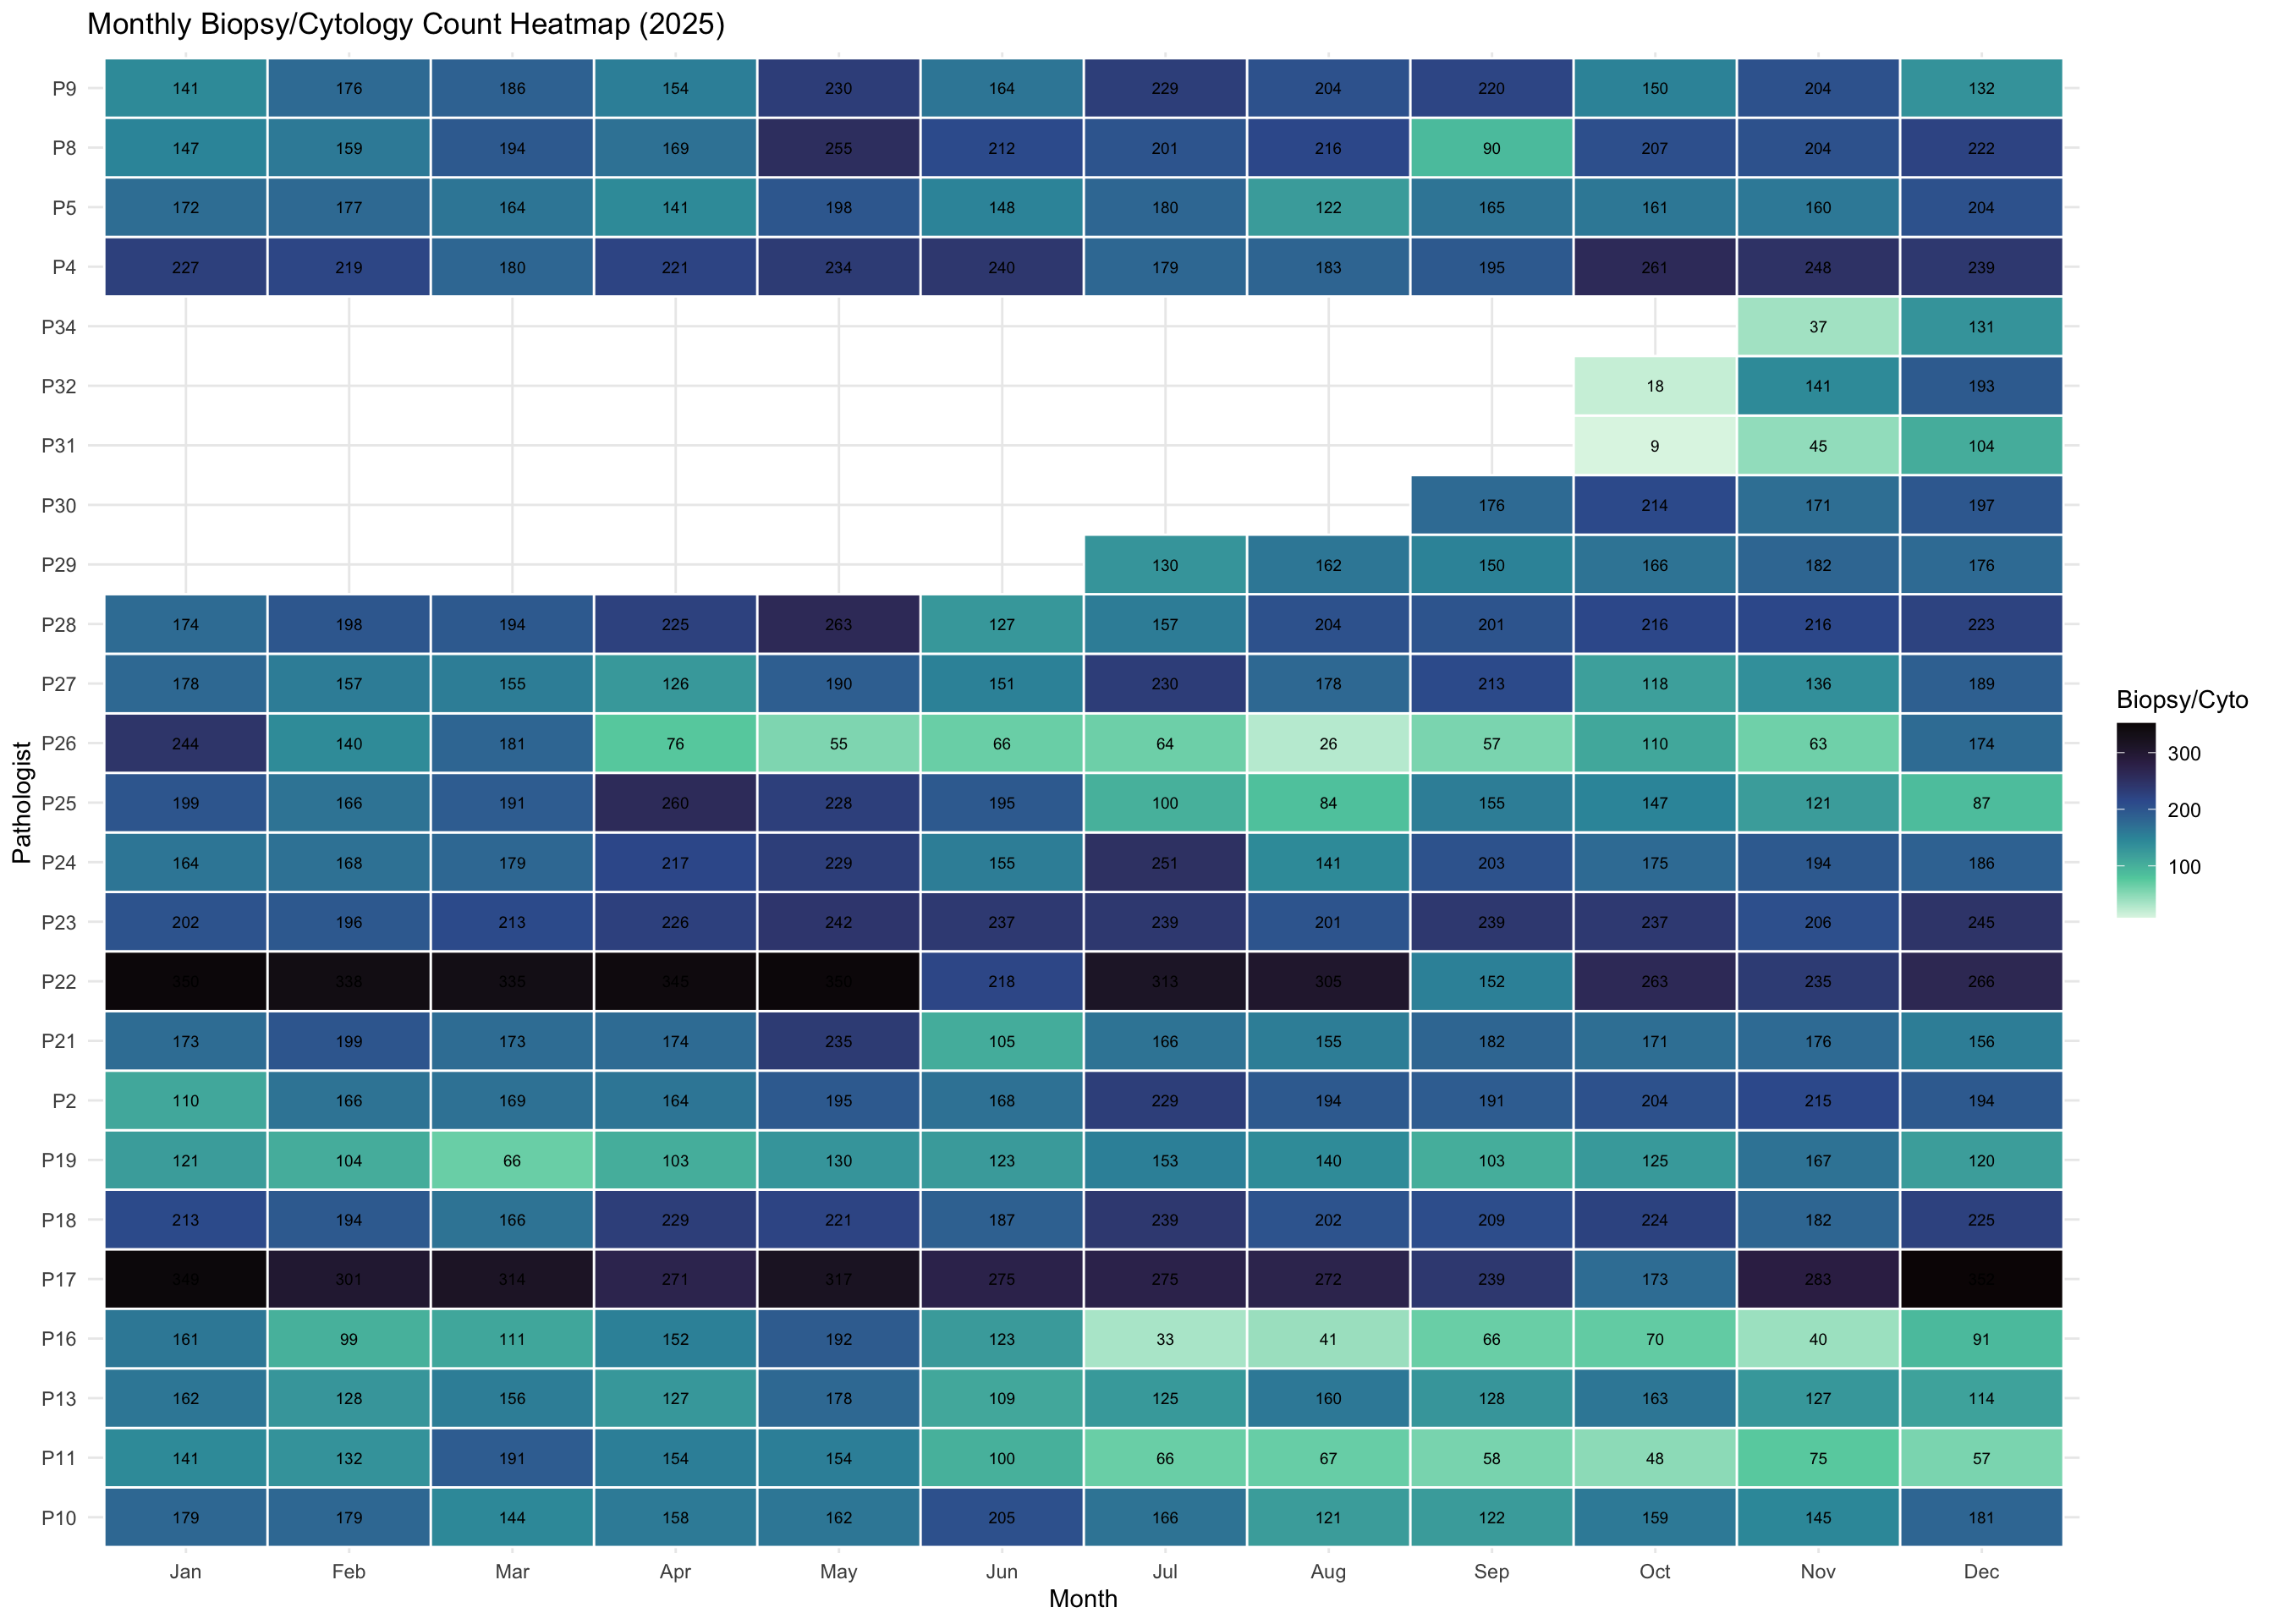
13.11 Consultation vs Routine Workload (Monthly Granularity)
For each month in 2025, compare each pathologist’s consultation count with their routine workload.
13.11.1 Consultation Burden
The fraction of a pathologist’s total score that comes from consultations provides a “consultation burden” metric.
13.12 Leave-Adjusted TAT Analysis
For months where a pathologist had significant leave (>5 days), compare their turnaround time.
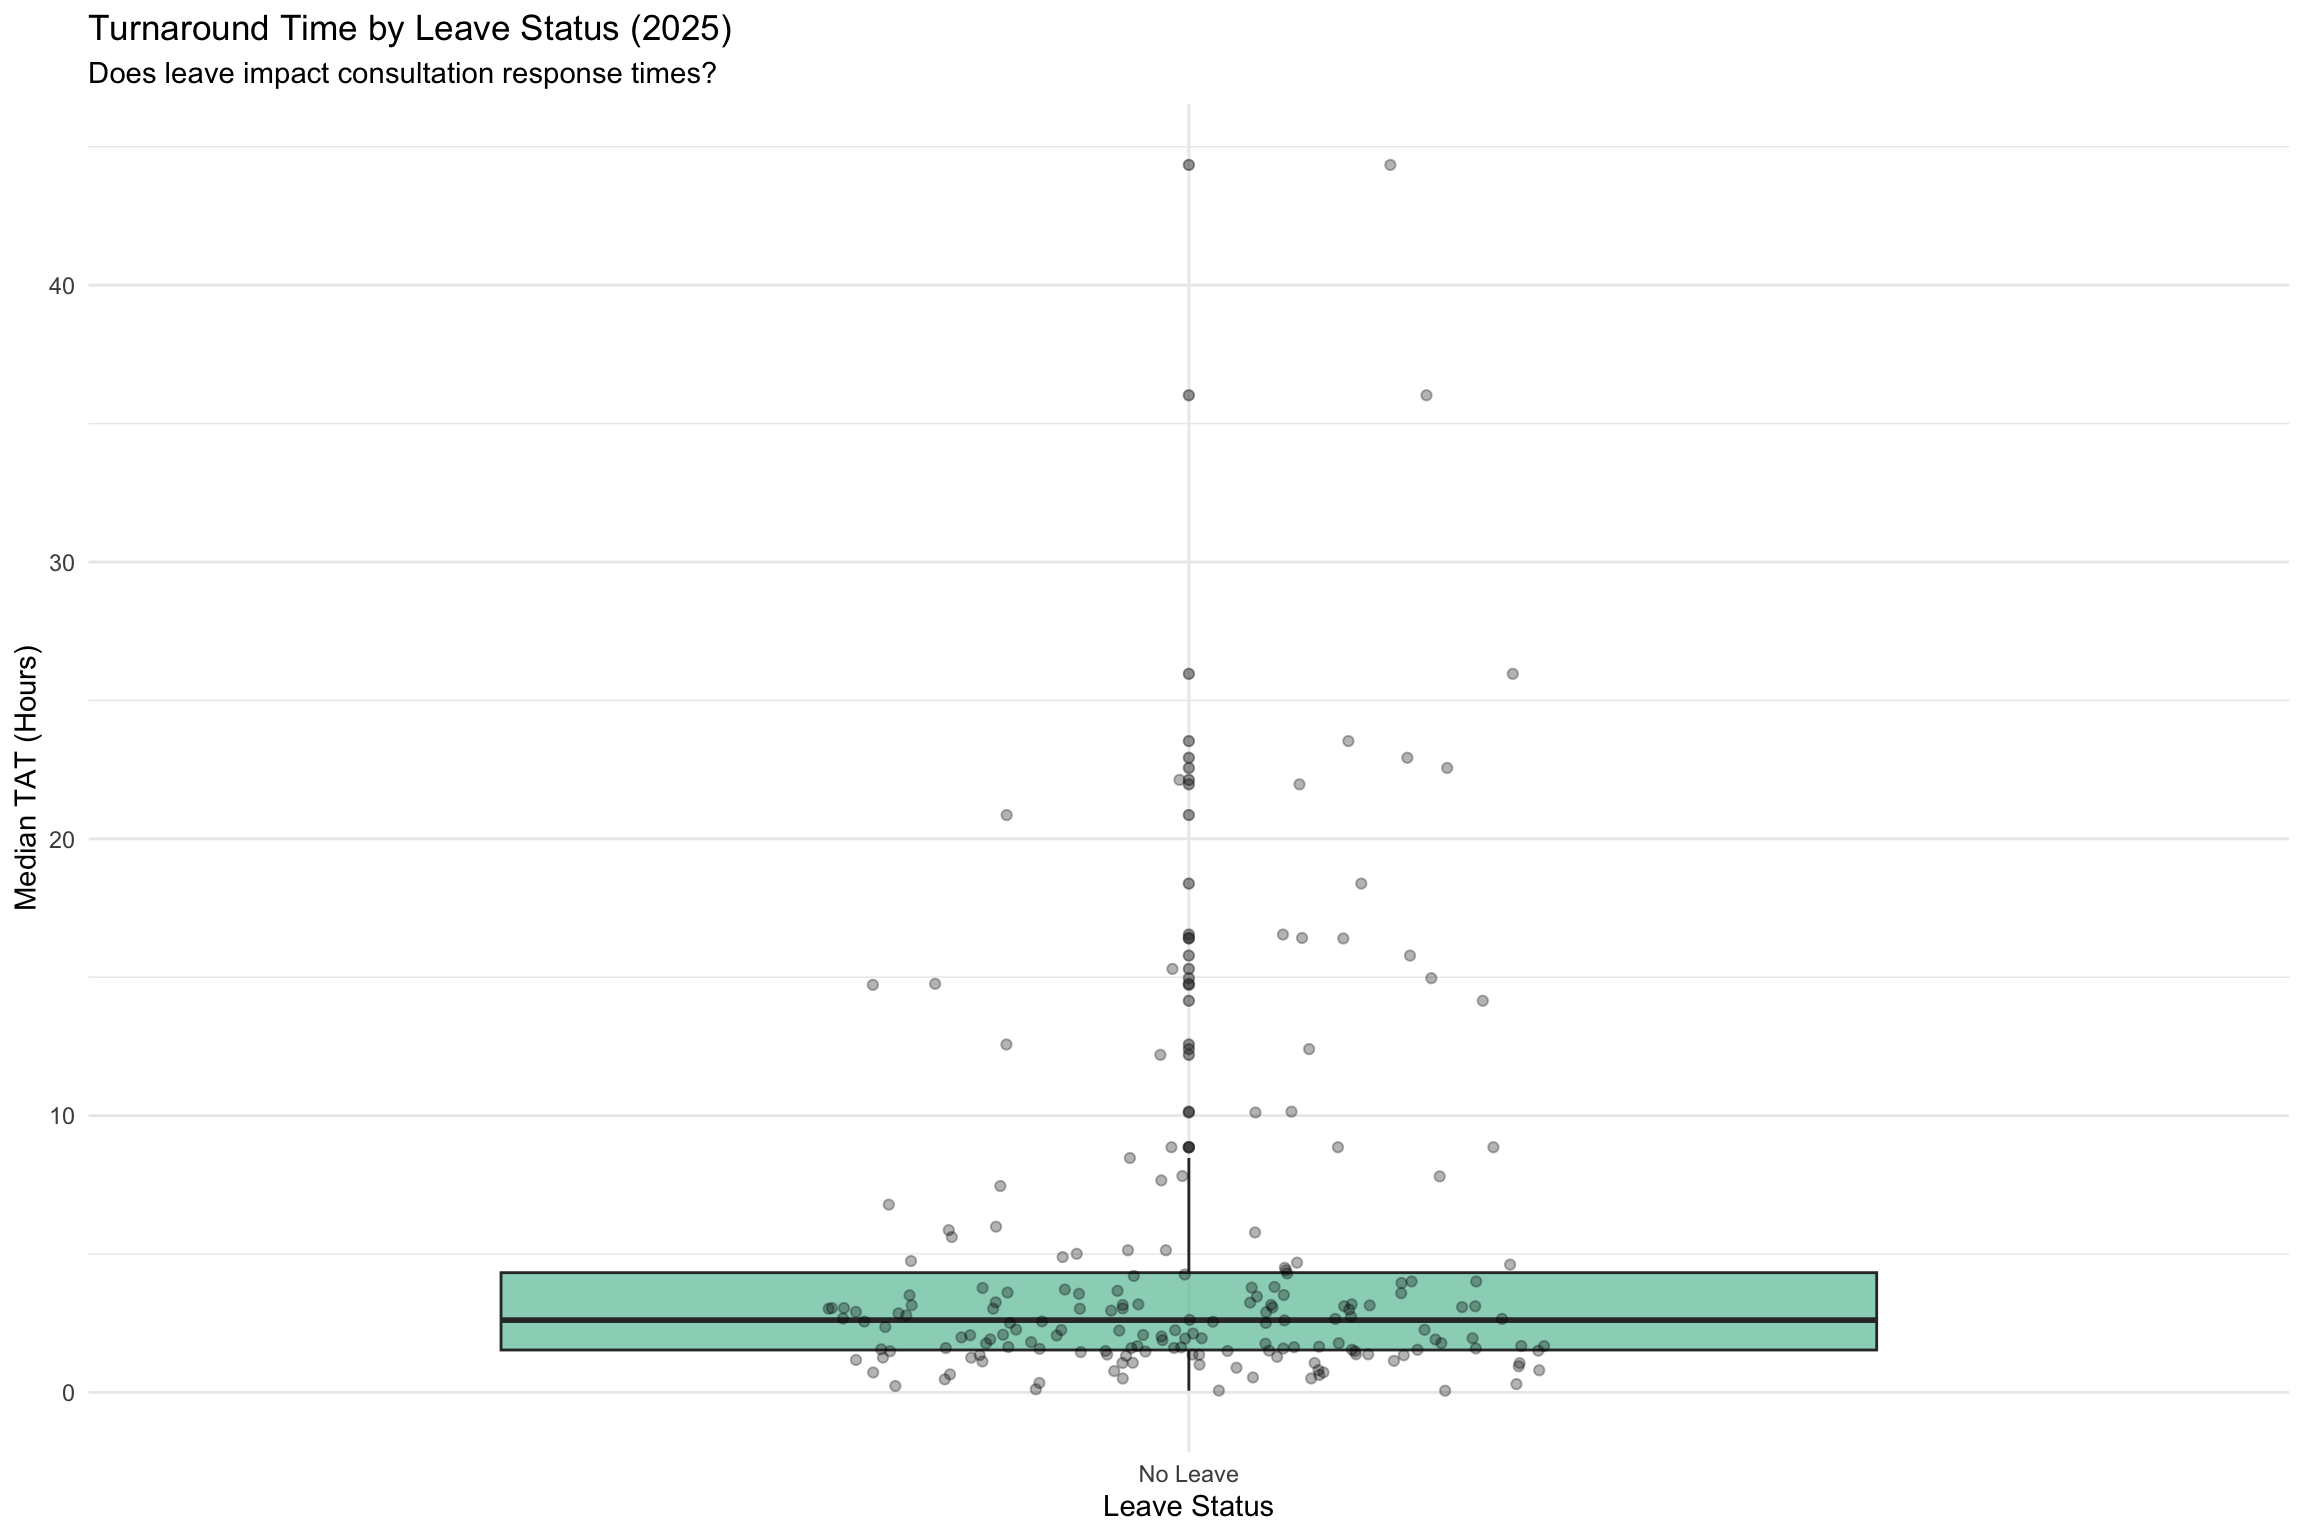
| Leave_Status | N_Observations | Median_TAT_Hours | Mean_TAT_Hours | SD_TAT_Hours |
|---|---|---|---|---|
| No Leave | 184 | 2.6 | 4.8 | 6.4 |
13.13 Workload Recommendations
Effective workload management requires balancing consultation demands with routine diagnostic responsibilities (Bonert et al. 2021; Hanna et al. 2024).
| Category | Finding | Recommendation |
|---|---|---|
| Overload Risk | P8 handles 1102 consultations (3.2x average) | Consider redistributing workload to prevent burnout and bottlenecks |
| Underutilization | Some pathologists handle <25% of average workload | Investigate reasons for low consultation rates and consider capacity reallocation |
13.14 Summary Statistics
| Metric | Value |
|---|---|
| Total Pathologists | 34.000 |
| Mean Consultations per Pathologist | 346.000 |
| Median Consultations per Pathologist | 251.500 |
| SD Consultations per Pathologist | 316.100 |
| Max Consultations (Single Pathologist) | 1102.000 |
| Min Consultations (Single Pathologist) | 4.000 |
| Gini Coefficient (Total Workload) | 0.496 |
| % Primarily Experts (≥75% providing) | 14.700 |
| % Primarily Askers (≥75% requesting) | 44.100 |
| % Balanced Roles | 14.700 |