[1] TRUE15 Consultation Rate Analysis
This chapter connects consultation data with the department’s full case database to compute consultation rates — both department-wide and per pathologist.
15.1 Monthly Case Volume
The department’s total monthly case volume provides context for understanding consultation patterns. Cases are counted as unique biopsy numbers per month from the full departmental database (329,997 unique cases across 65 months).
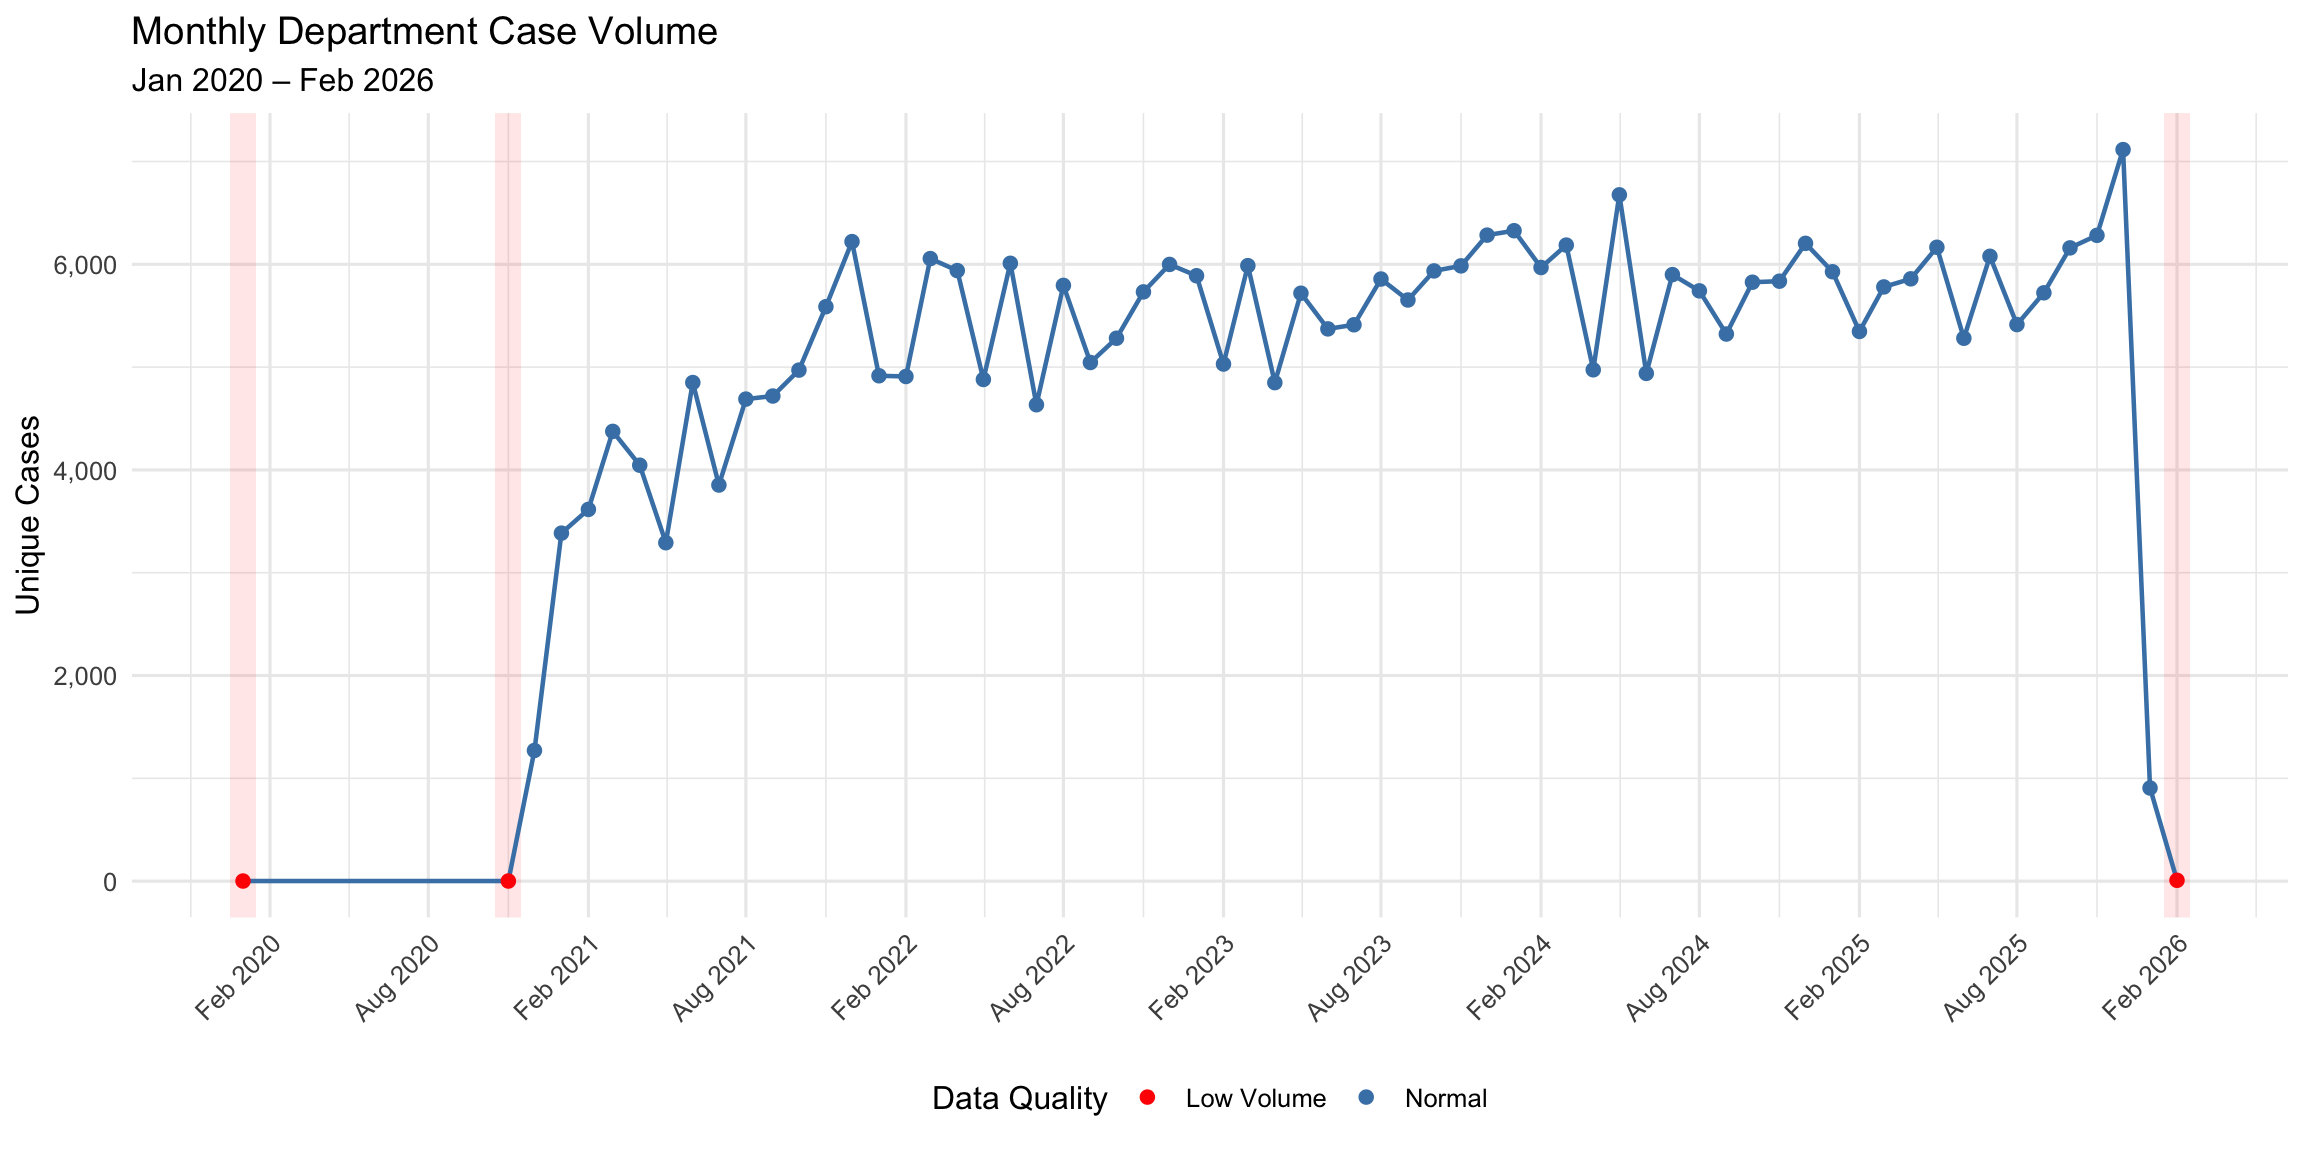
15.1.1 Yearly Summary
| Year | Months | Total Cases | Mean/Month | Median/Month | Min | Max | Flagged Months |
|---|---|---|---|---|---|---|---|
| 2,020 | 3 | 1,273 | 424 | 1 | 1 | 1,271 | 2 |
| 2,021 | 12 | 53,605 | 4,467 | 4,532 | 3,292 | 6,221 | 0 |
| 2,022 | 12 | 65,196 | 5,433 | 5,506 | 4,634 | 6,056 | 0 |
| 2,023 | 12 | 67,973 | 5,664 | 5,788 | 4,849 | 6,284 | 0 |
| 2,024 | 12 | 69,902 | 5,825 | 5,868 | 4,939 | 6,676 | 0 |
| 2,025 | 12 | 71,134 | 5,928 | 5,894 | 5,281 | 7,116 | 0 |
| 2,026 | 2 | 914 | 457 | 457 | 8 | 906 | 1 |
15.2 Consultation Rate as Percentage of Total Cases
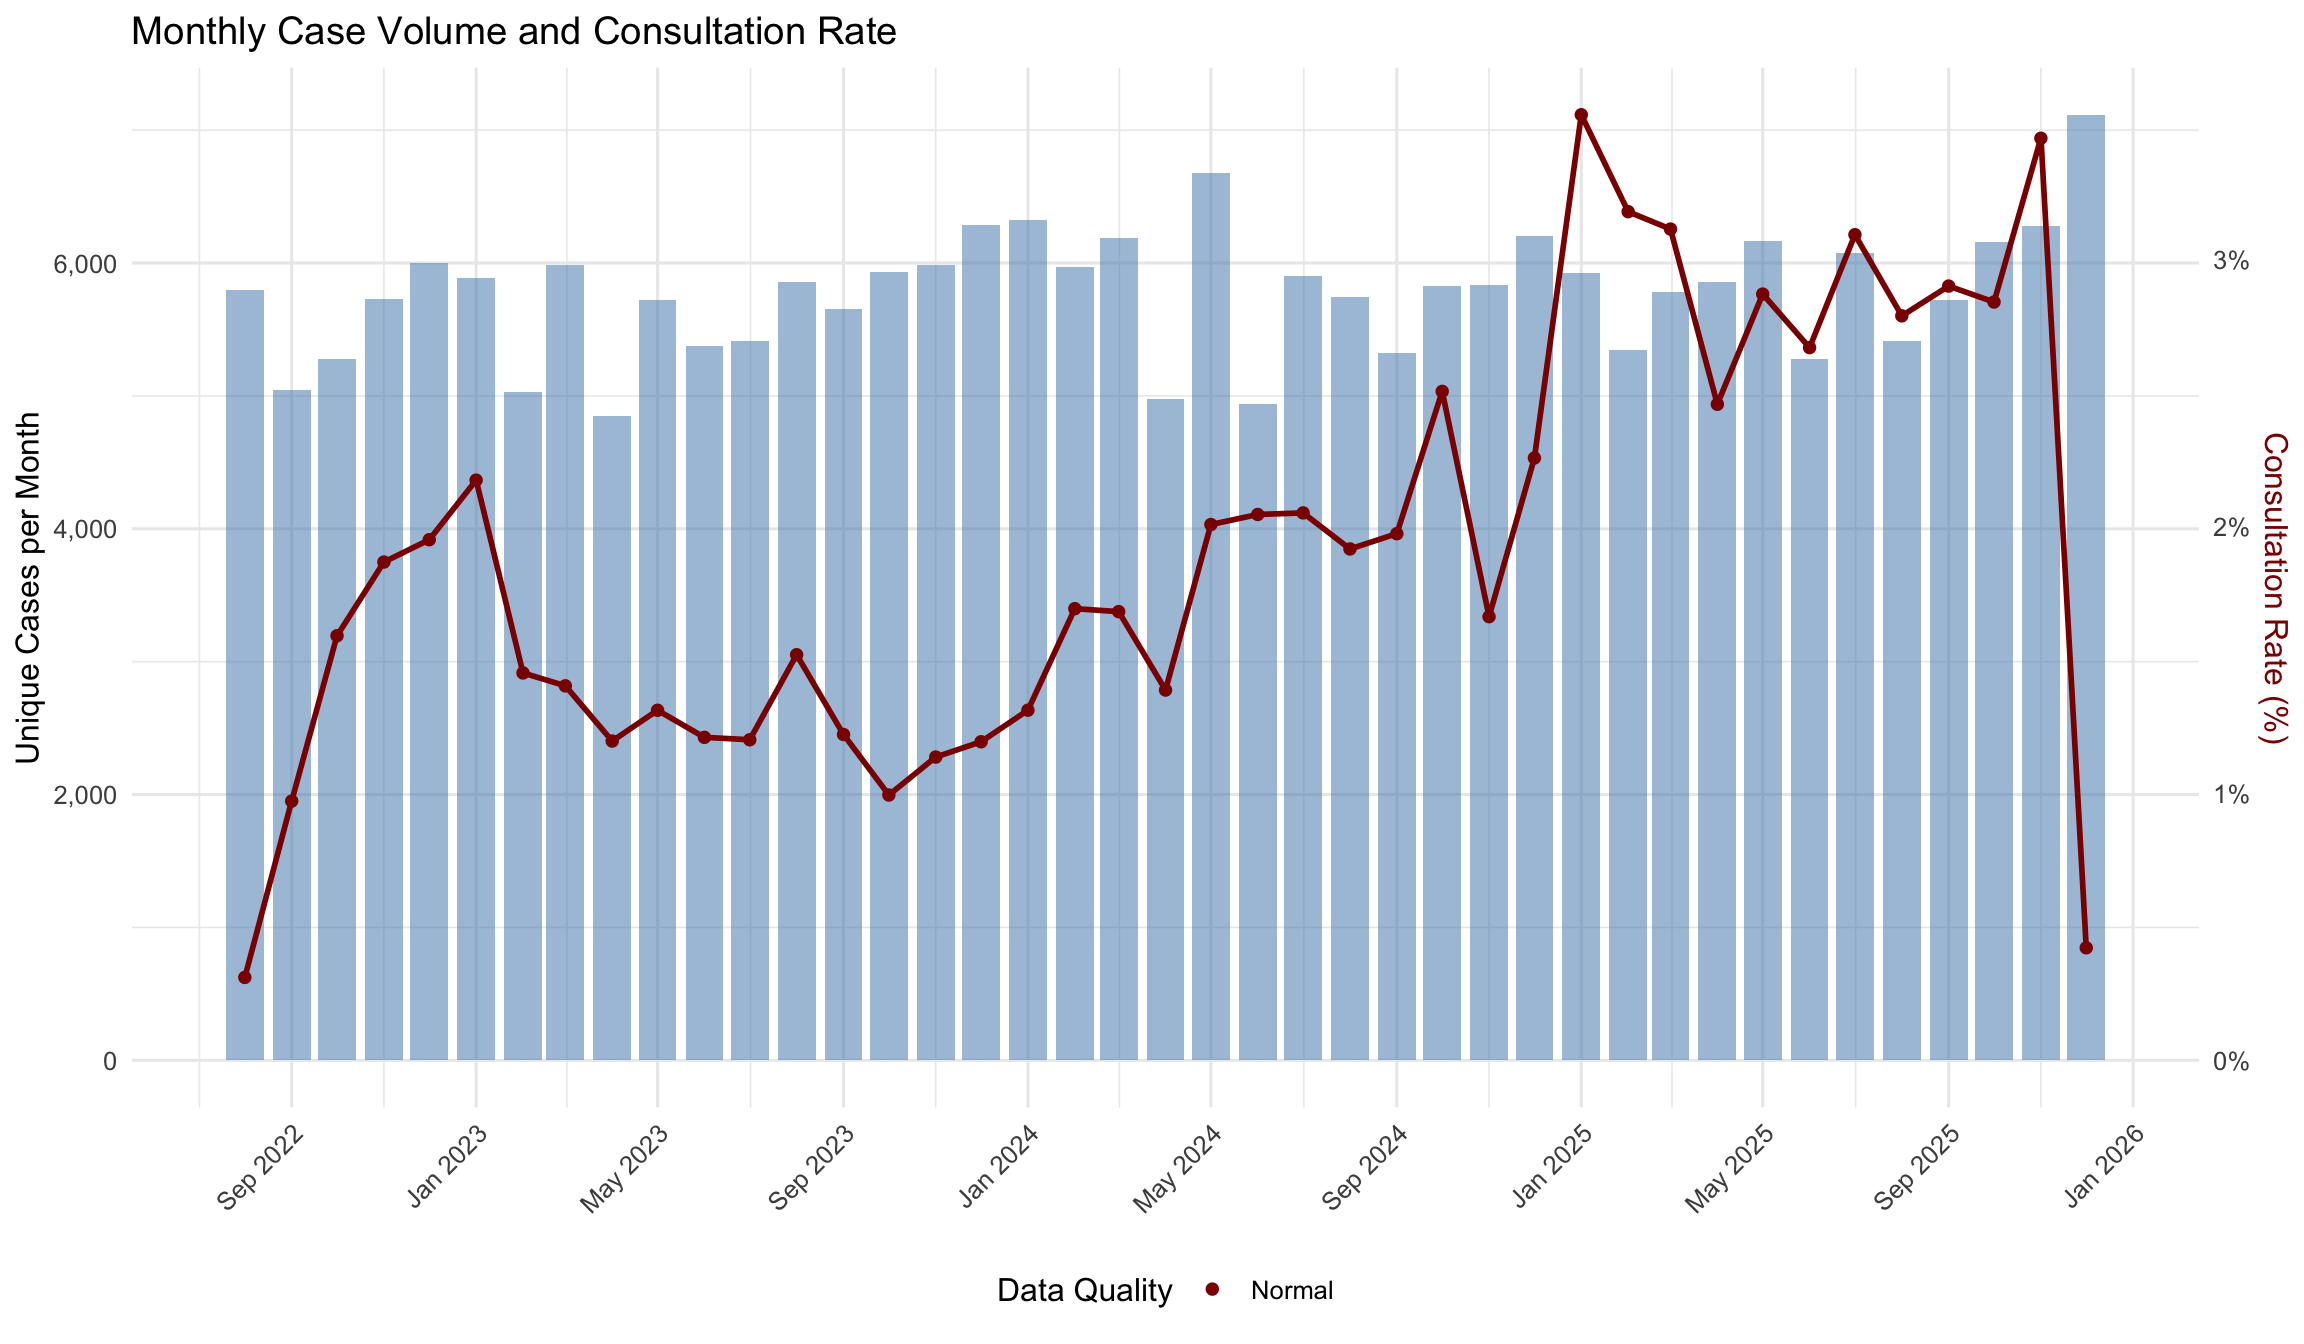
By comparing monthly consultation counts with total cases processed, we can assess how frequently consultations are triggered relative to overall workload.
The consultation rate is computed as:
\[\text{Consultation Rate (\%)} = \frac{\text{Unique Cases with Consultation per Month}}{\text{Total Unique Cases per Month}} \times 100\]
Over the 41 months with normal data quality (overlap period: Aug 2022 – Dec 2025), the consultation rate ranges from 0.31% to 3.54% (median 1.87%).
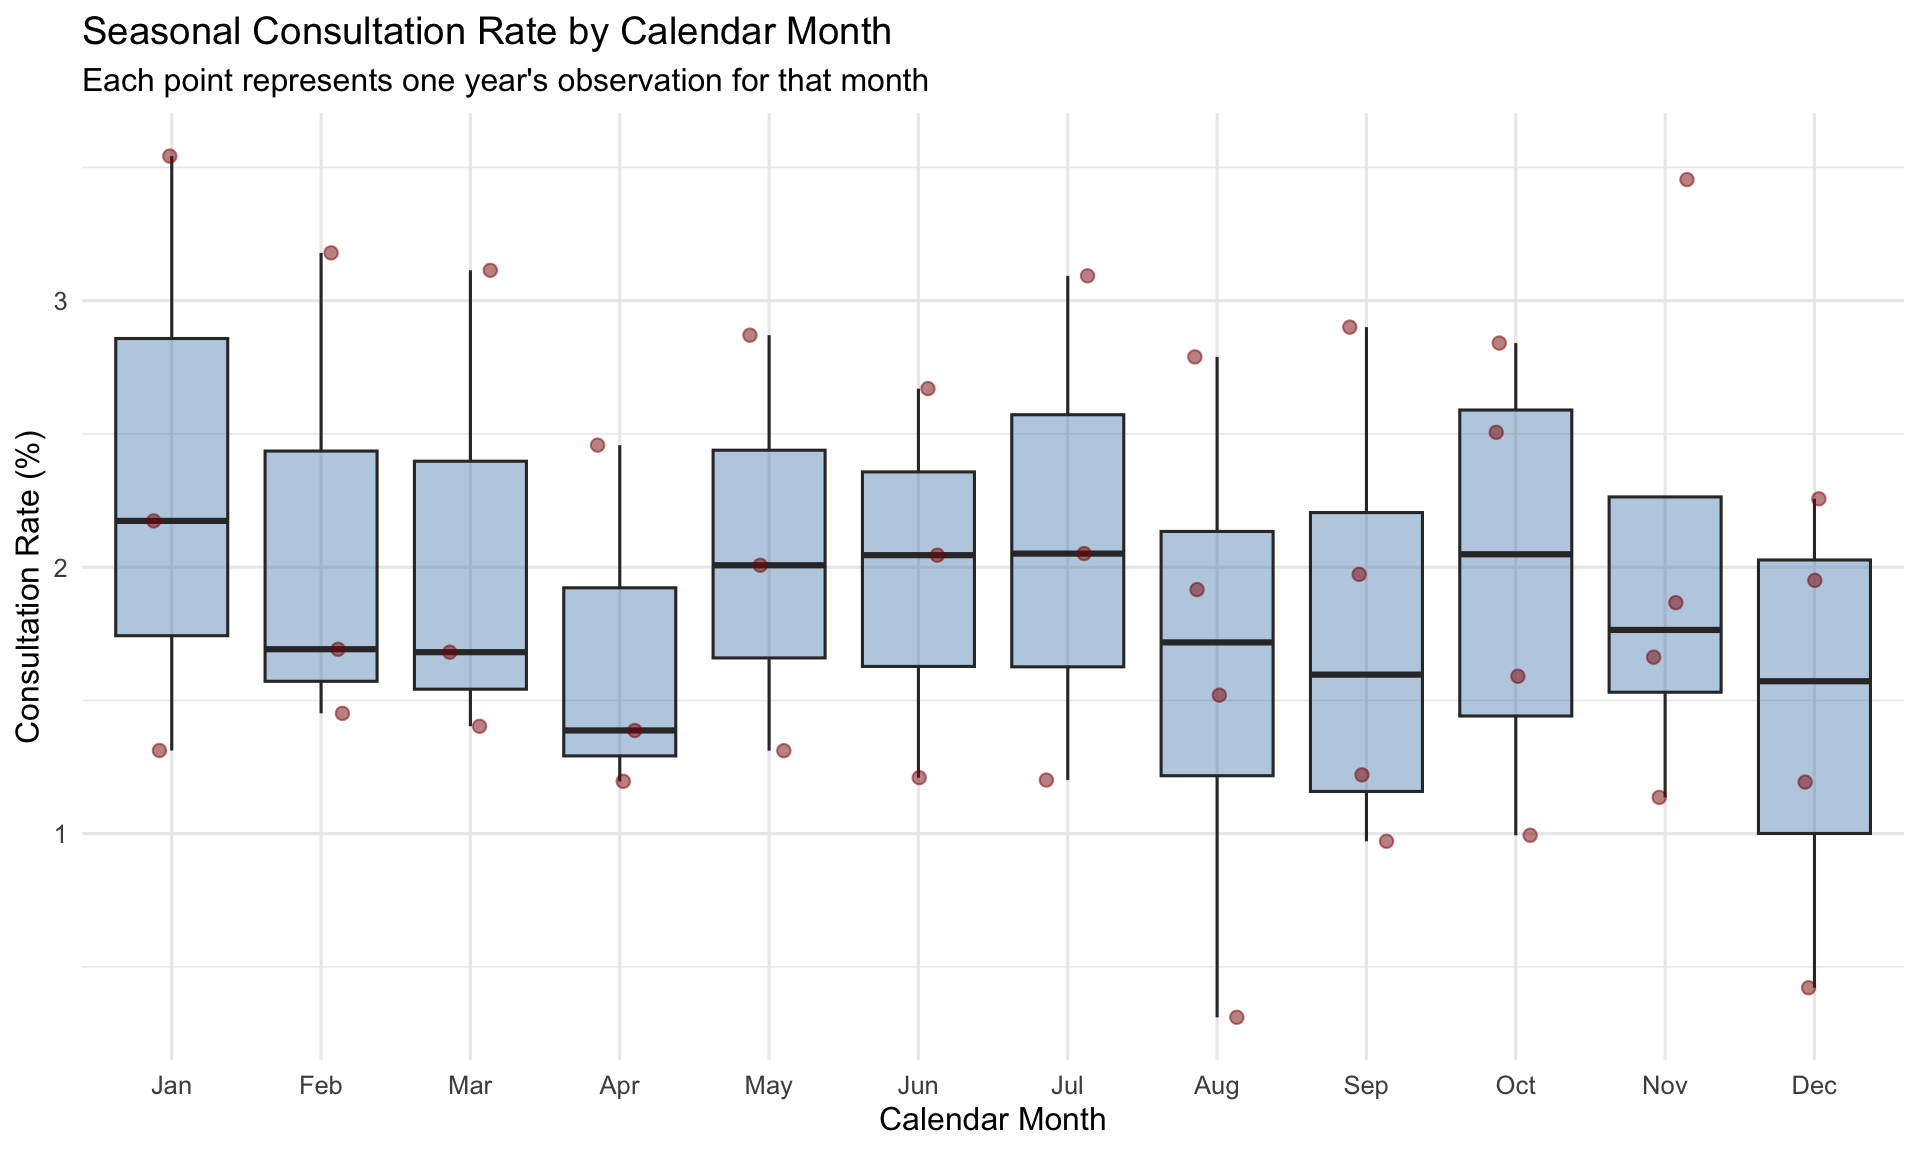
15.2.1 Seasonal Pattern
15.2.2 Monthly Consultation Rate Table
| Month | Total Cases | Cases with Consultation | Rate (%) | Data Quality |
|---|---|---|---|---|
| 2022-08 | 5,795 | 18 | 0.31 | Normal |
| 2022-09 | 5,045 | 49 | 0.97 | Normal |
| 2022-10 | 5,281 | 84 | 1.59 | Normal |
| 2022-11 | 5,732 | 107 | 1.87 | Normal |
| 2022-12 | 5,999 | 117 | 1.95 | Normal |
| 2023-01 | 5,889 | 128 | 2.17 | Normal |
| 2023-02 | 5,030 | 73 | 1.45 | Normal |
| 2023-03 | 5,987 | 84 | 1.40 | Normal |
| 2023-04 | 4,849 | 58 | 1.20 | Normal |
| 2023-05 | 5,719 | 75 | 1.31 | Normal |
| 2023-06 | 5,372 | 65 | 1.21 | Normal |
| 2023-07 | 5,412 | 65 | 1.20 | Normal |
| 2023-08 | 5,857 | 89 | 1.52 | Normal |
| 2023-09 | 5,653 | 69 | 1.22 | Normal |
| 2023-10 | 5,936 | 59 | 0.99 | Normal |
| 2023-11 | 5,985 | 68 | 1.14 | Normal |
| 2023-12 | 6,284 | 75 | 1.19 | Normal |
| 2024-01 | 6,327 | 83 | 1.31 | Normal |
| 2024-02 | 5,969 | 101 | 1.69 | Normal |
| 2024-03 | 6,187 | 104 | 1.68 | Normal |
| 2024-04 | 4,974 | 69 | 1.39 | Normal |
| 2024-05 | 6,676 | 134 | 2.01 | Normal |
| 2024-06 | 4,939 | 101 | 2.04 | Normal |
| 2024-07 | 5,900 | 121 | 2.05 | Normal |
| 2024-08 | 5,742 | 110 | 1.92 | Normal |
| 2024-09 | 5,322 | 105 | 1.97 | Normal |
| 2024-10 | 5,826 | 146 | 2.51 | Normal |
| 2024-11 | 5,836 | 97 | 1.66 | Normal |
| 2024-12 | 6,204 | 140 | 2.26 | Normal |
| 2025-01 | 5,928 | 210 | 3.54 | Normal |
| 2025-02 | 5,347 | 170 | 3.18 | Normal |
| 2025-03 | 5,780 | 180 | 3.11 | Normal |
| 2025-04 | 5,859 | 144 | 2.46 | Normal |
| 2025-05 | 6,166 | 177 | 2.87 | Normal |
| 2025-06 | 5,281 | 141 | 2.67 | Normal |
| 2025-07 | 6,078 | 188 | 3.09 | Normal |
| 2025-08 | 5,414 | 151 | 2.79 | Normal |
| 2025-09 | 5,723 | 166 | 2.90 | Normal |
| 2025-10 | 6,160 | 175 | 2.84 | Normal |
| 2025-11 | 6,282 | 217 | 3.45 | Normal |
| 2025-12 | 7,116 | 30 | 0.42 | Normal |
15.3 Per-Pathologist Monthly Consultation Rates
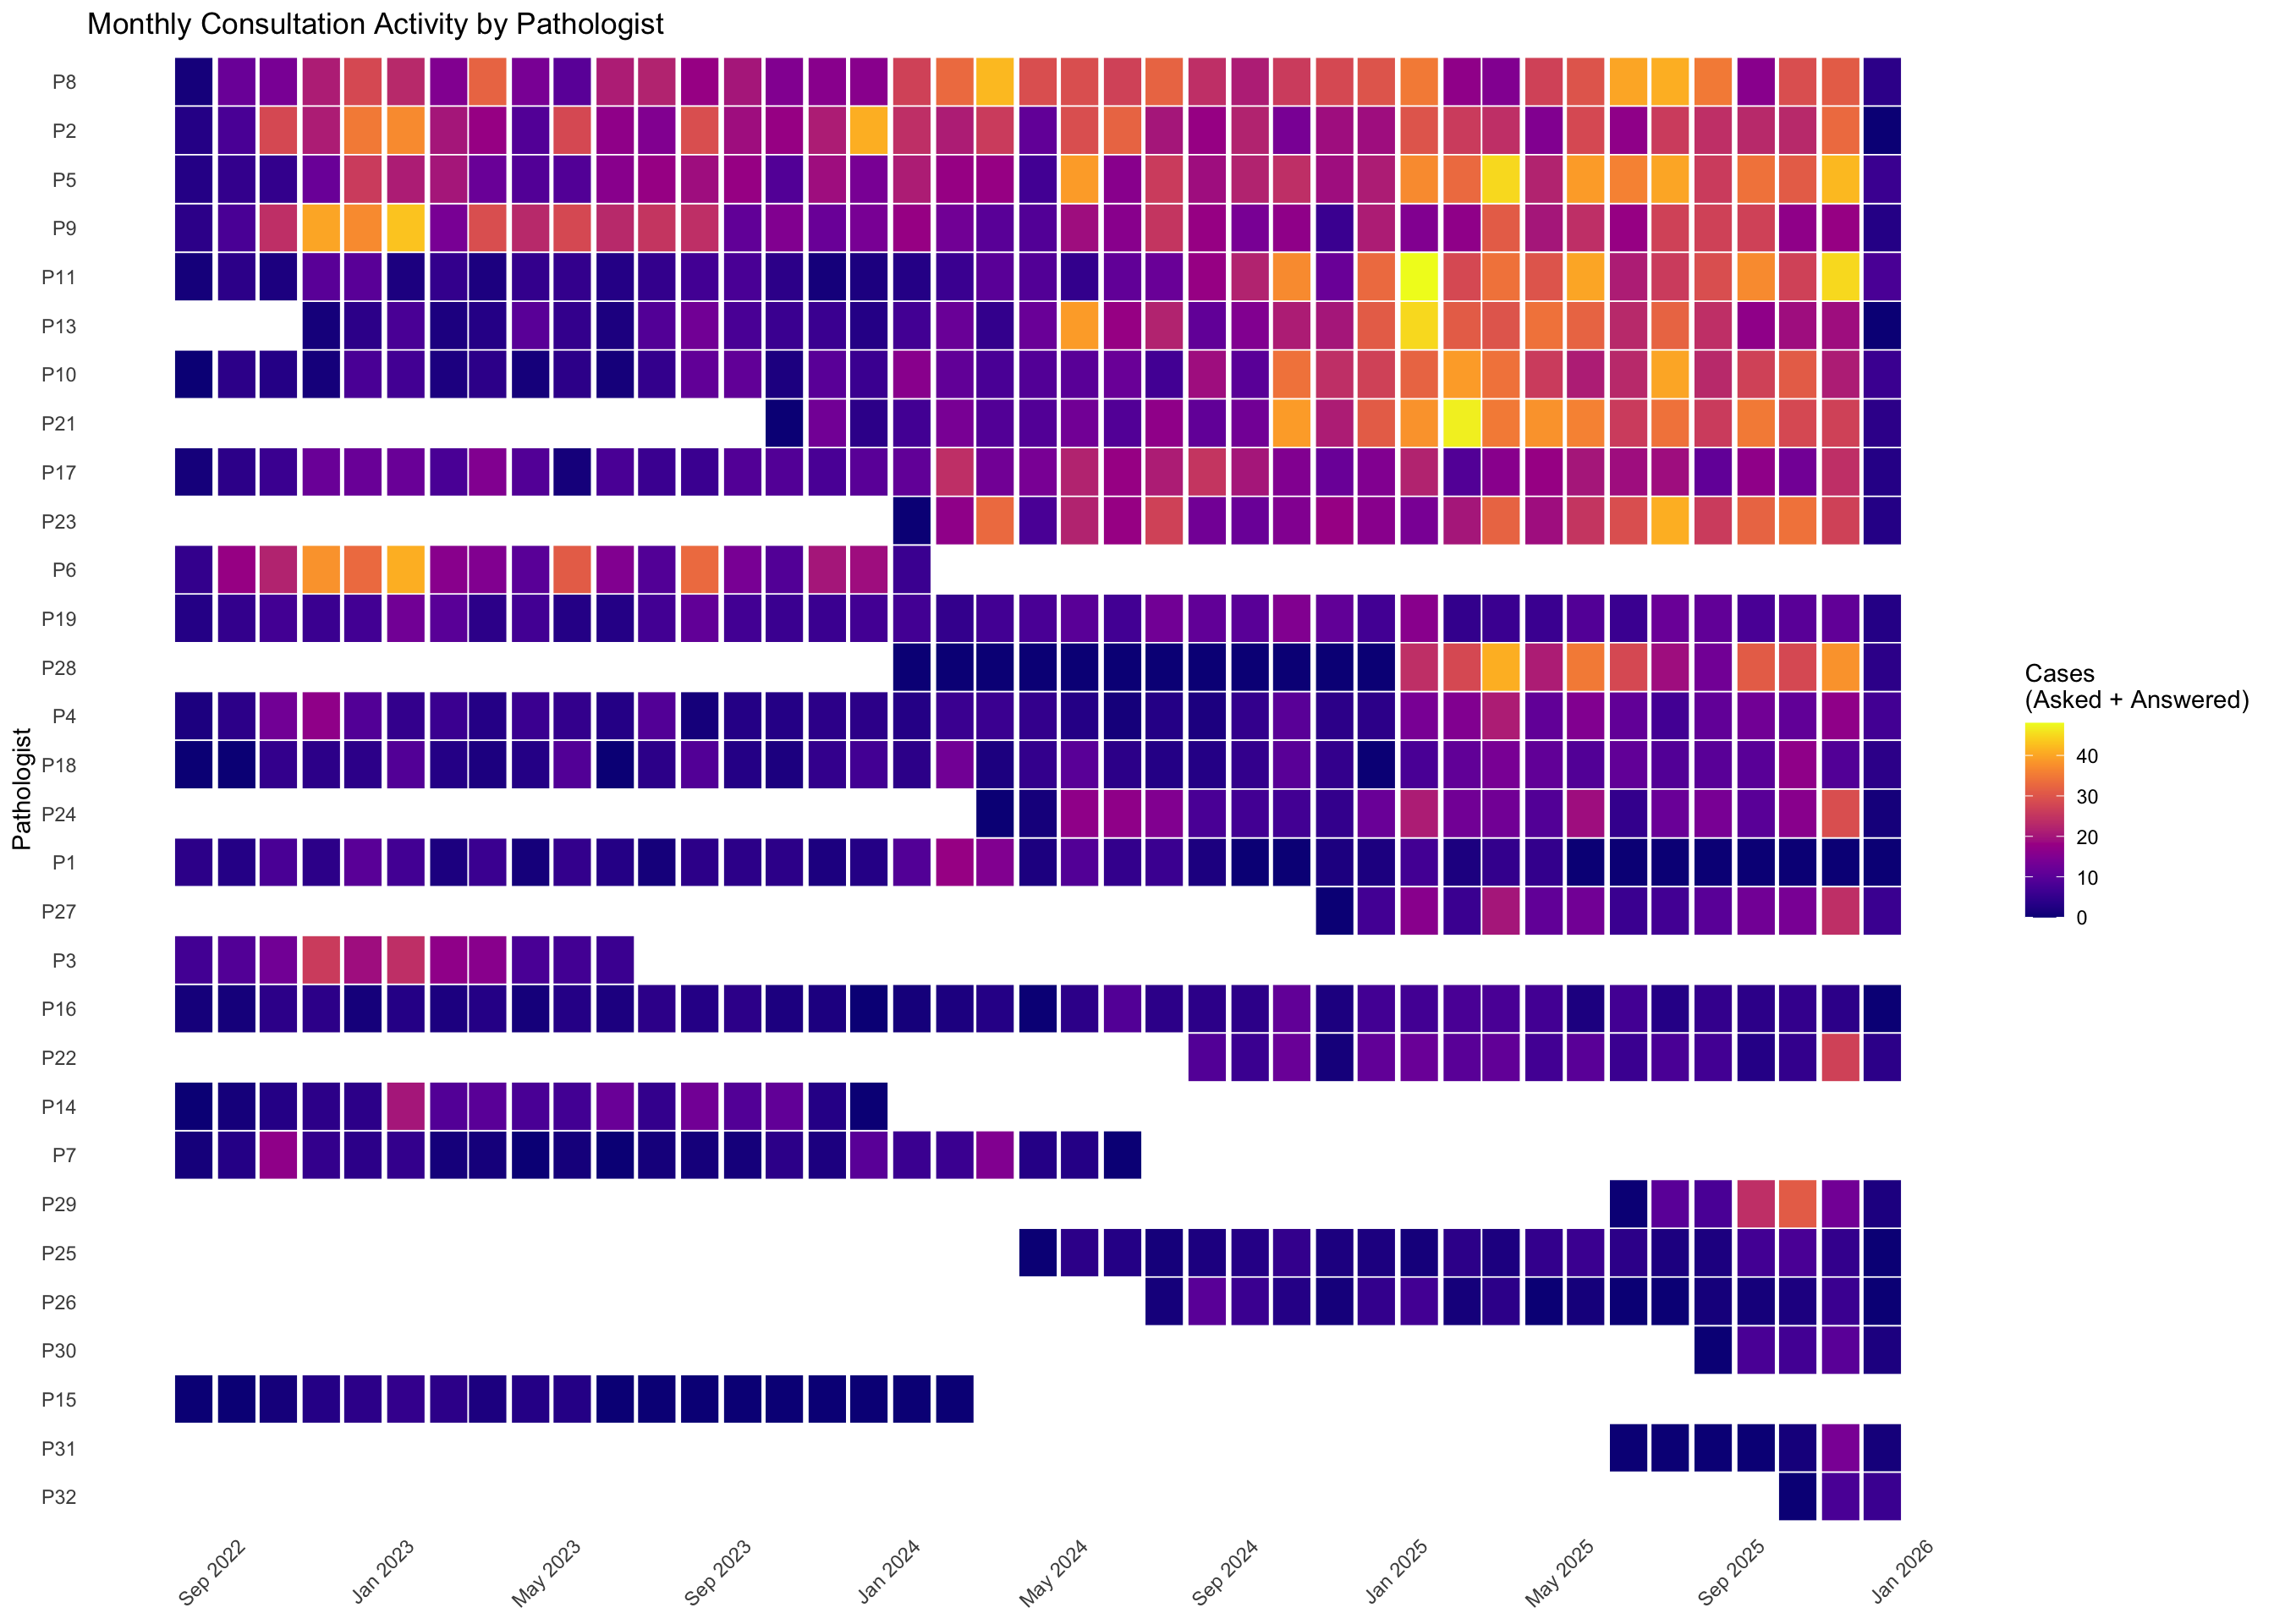
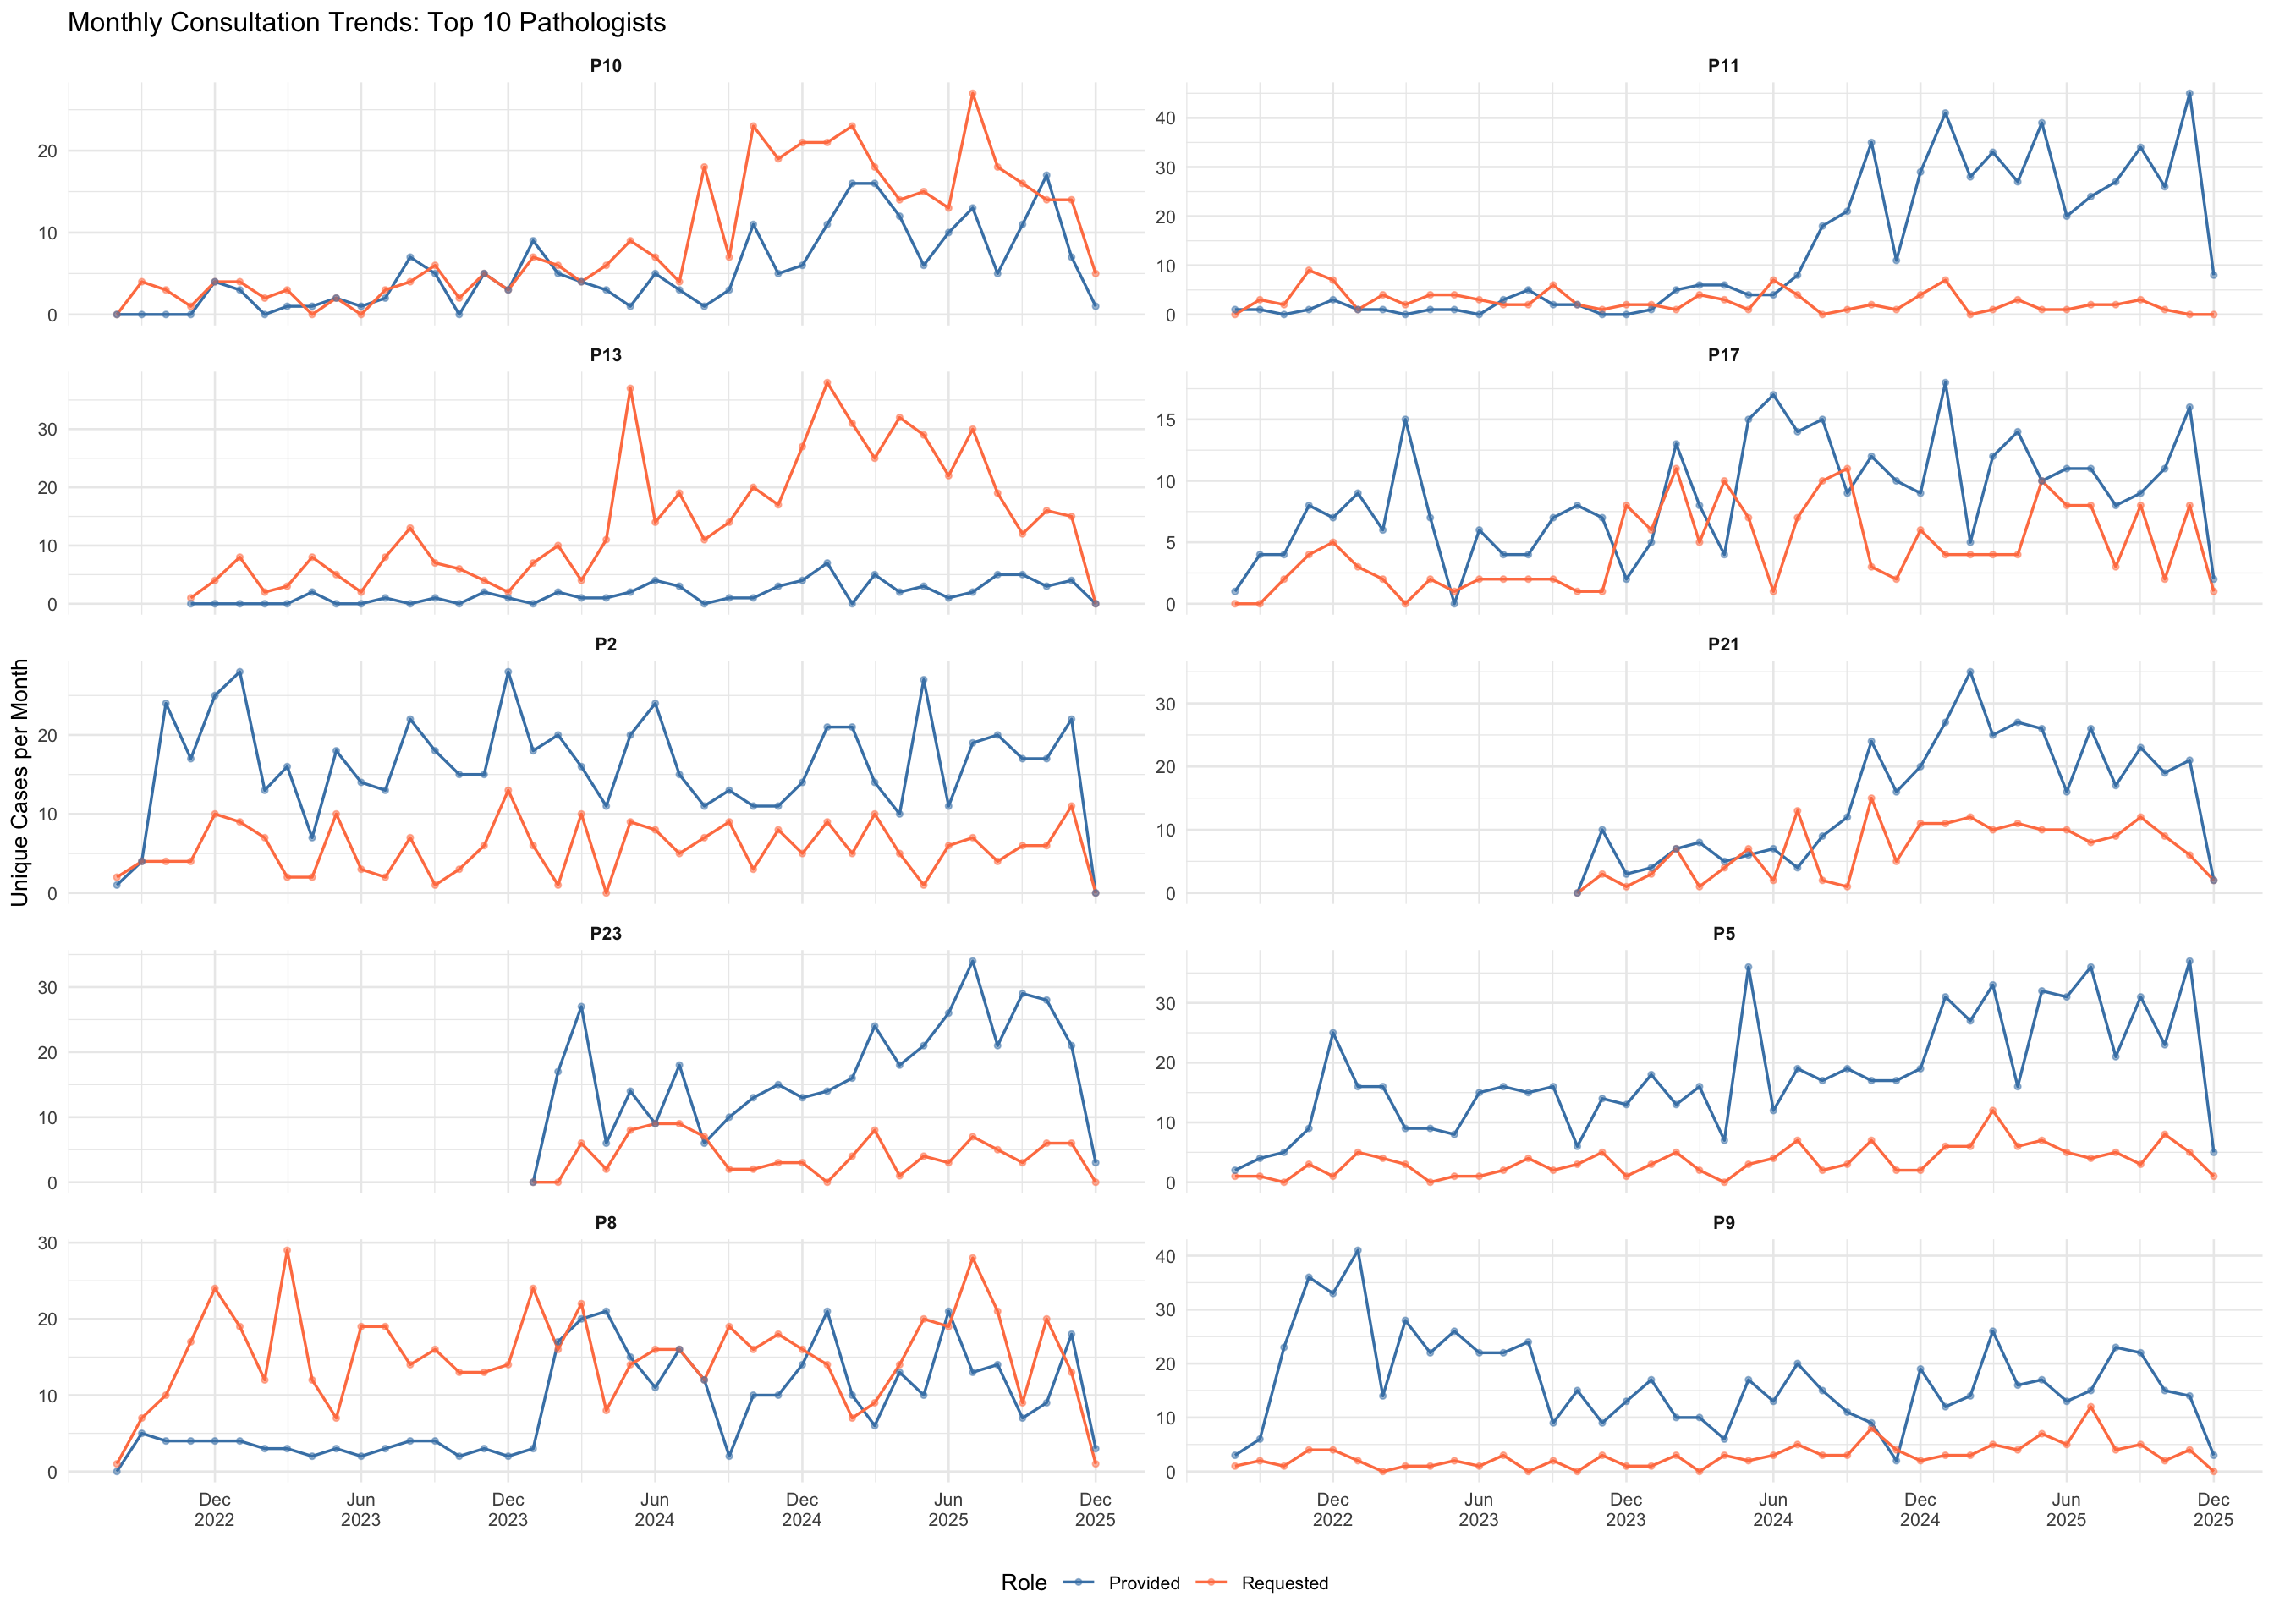
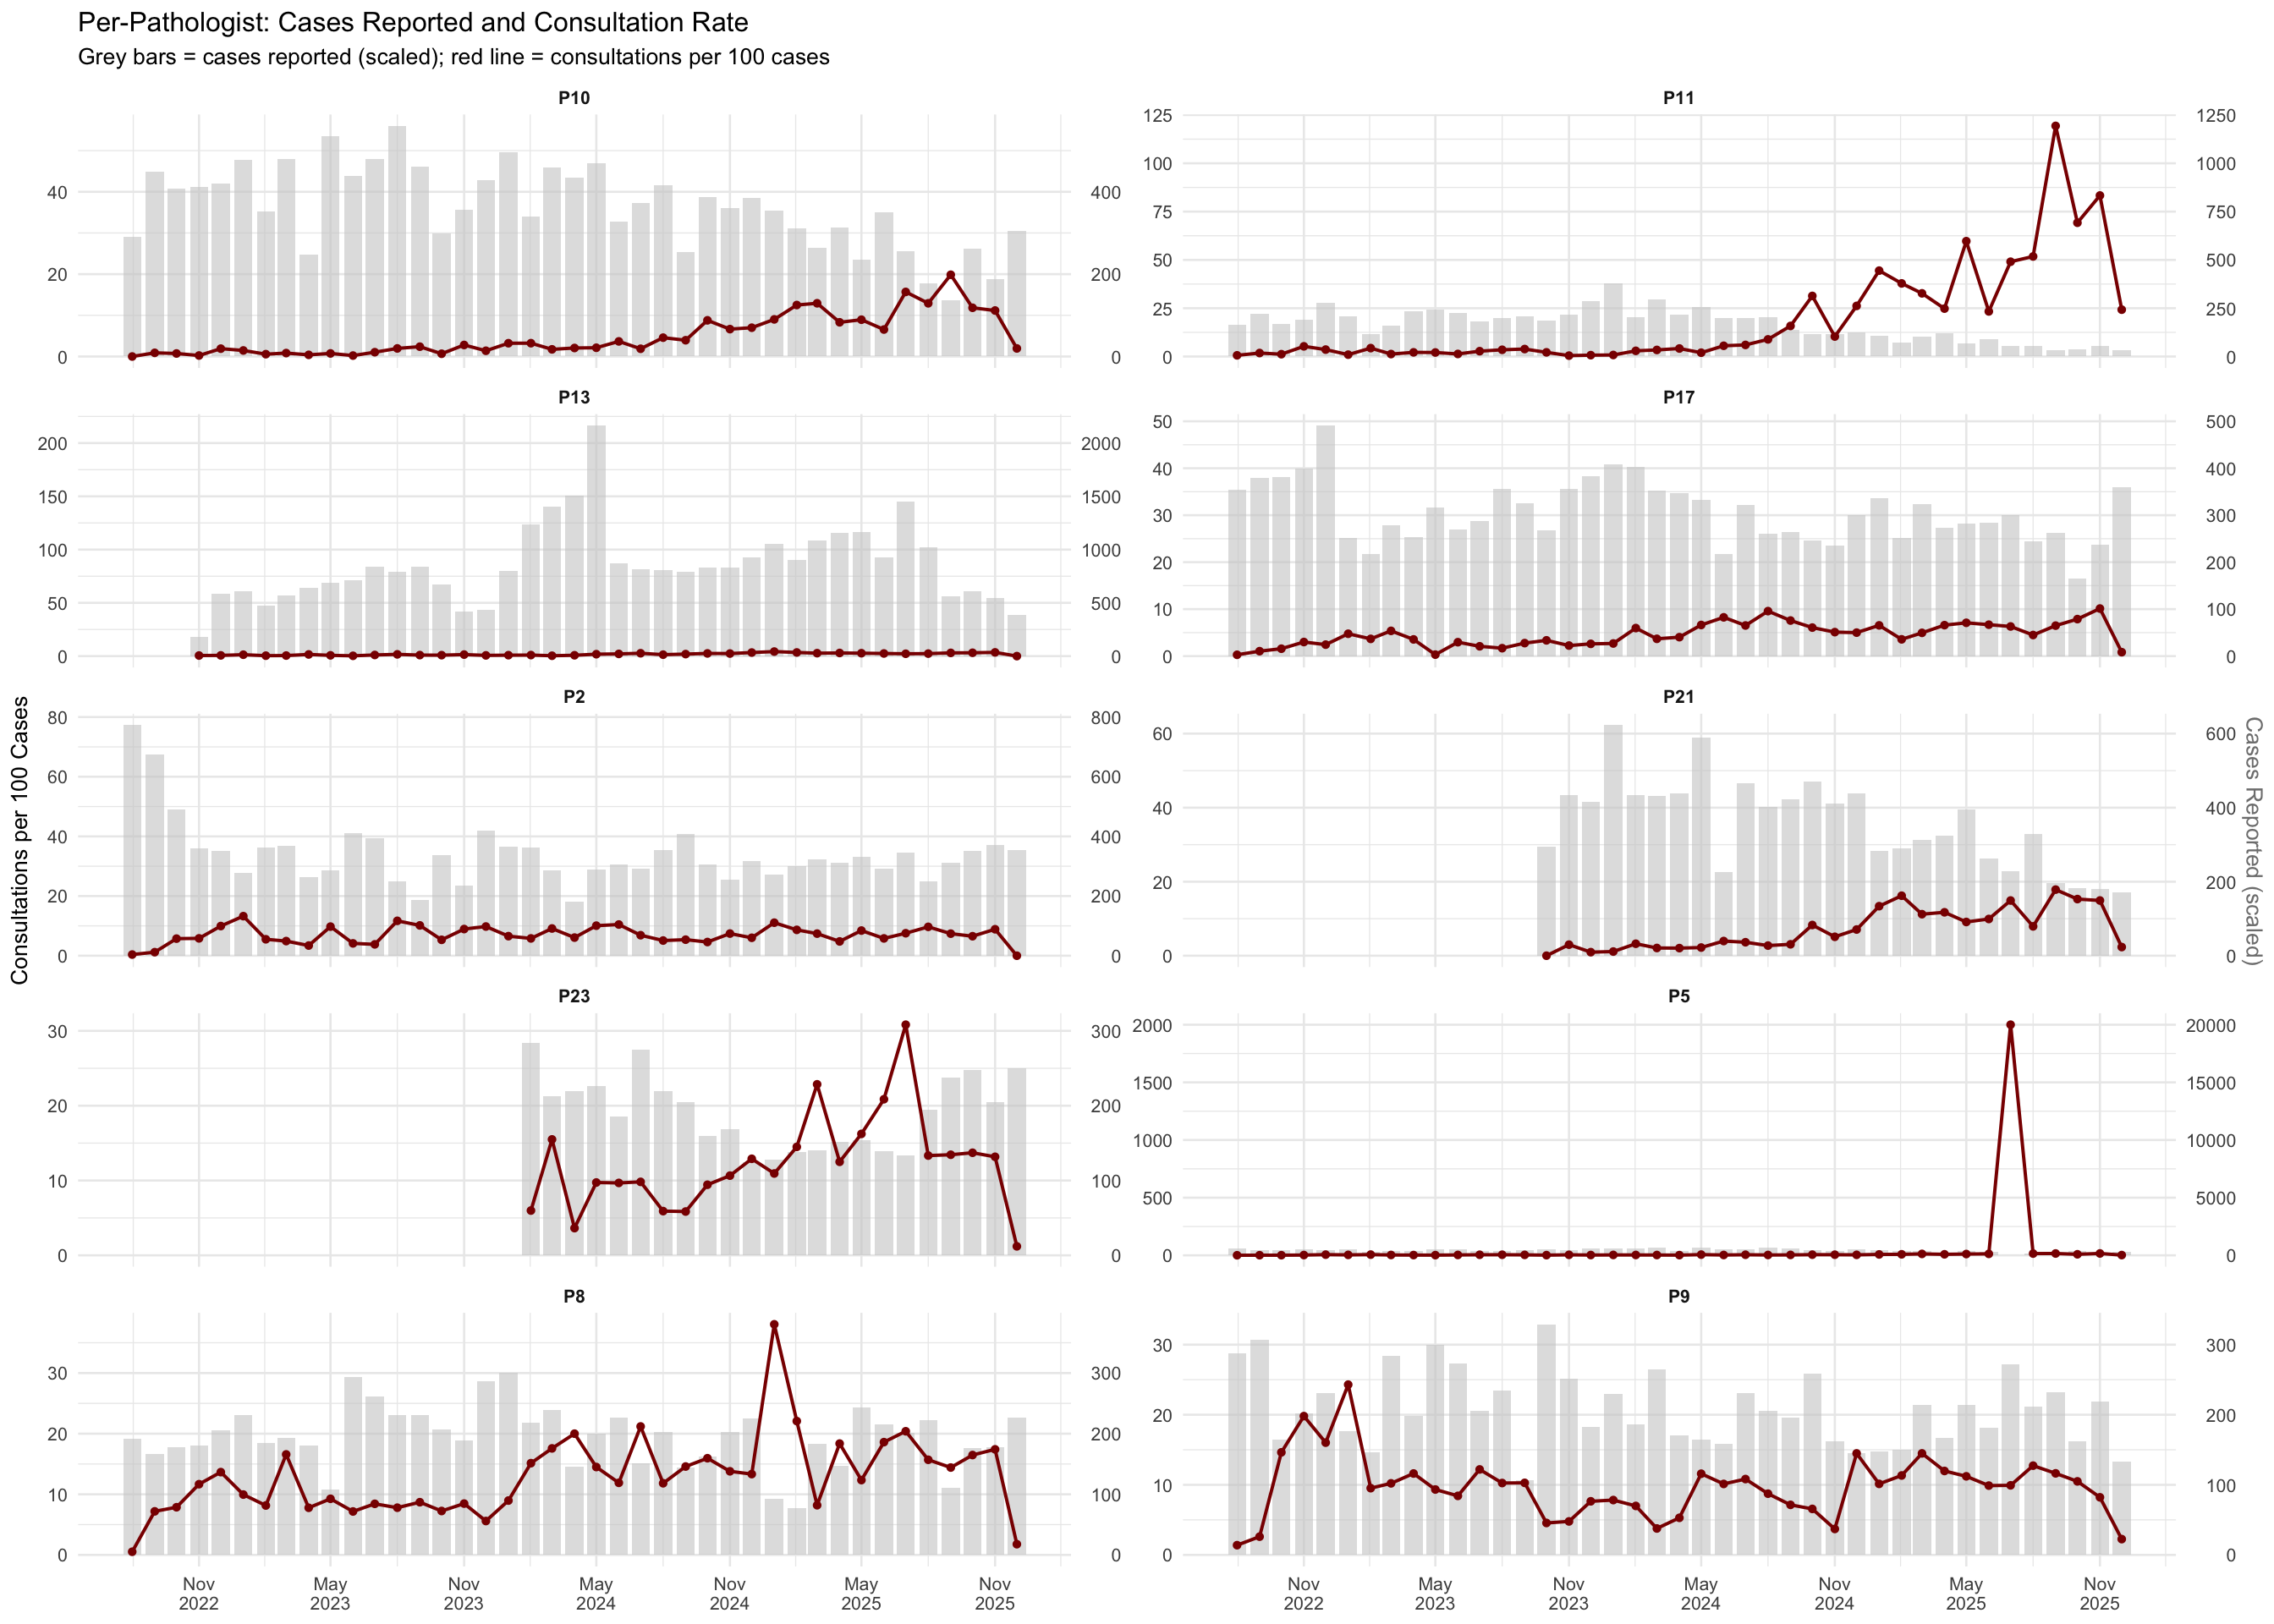
For each pathologist, we compute monthly rates of consultations asked and answered, restricted to months when they were actively employed.
15.3.1 Consultation Heatmap
15.3.2 Top Pathologists: Monthly Trends
15.3.3 Per-Pathologist Cases Reported and Consultation Rate
15.3.4 Summary Statistics
| Pathologist | Active Months | Cases Asked | Cases Answered | Total Cases | Mean/Month | Median/Month | Max/Month | Cases Reported | Rate/100 Cases |
|---|---|---|---|---|---|---|---|---|---|
| P8 | 41 | 618 | 348 | 966 | 23.6 | 24.0 | 42 | 8,005 | 12.07 |
| P2 | 41 | 230 | 661 | 891 | 21.7 | 21.0 | 41 | 13,975 | 6.38 |
| P5 | 41 | 145 | 731 | 876 | 21.4 | 19.0 | 45 | 17,800 | 4.92 |
| P9 | 41 | 119 | 685 | 804 | 19.6 | 18.0 | 43 | 8,557 | 9.40 |
| P11 | 41 | 105 | 522 | 627 | 15.3 | 10.0 | 48 | 6,759 | 9.28 |
| P13 | 38 | 533 | 66 | 599 | 15.8 | 12.5 | 45 | 32,321 | 1.85 |
| P10 | 41 | 375 | 215 | 590 | 14.4 | 10.0 | 40 | 14,948 | 3.95 |
| P21 | 27 | 185 | 399 | 584 | 21.6 | 21.0 | 47 | 9,651 | 6.05 |
| P17 | 41 | 180 | 357 | 537 | 13.1 | 12.0 | 25 | 12,579 | 4.27 |
| P23 | 24 | 98 | 403 | 501 | 20.9 | 19.5 | 41 | 4,401 | 11.38 |
| P6 | 18 | 108 | 246 | 354 | 19.7 | 17.0 | 41 | 7,208 | 4.91 |
| P19 | 41 | 99 | 227 | 326 | 8.0 | 7.0 | 16 | 10,324 | 3.16 |
| P28 | 24 | 188 | 122 | 310 | 12.9 | 2.0 | 41 | 1,829 | 16.95 |
| P4 | 41 | 223 | 79 | 302 | 7.4 | 6.0 | 21 | 19,255 | 1.57 |
| P18 | 41 | 174 | 82 | 256 | 6.2 | 5.0 | 17 | 12,616 | 2.03 |
| P24 | 22 | 131 | 120 | 251 | 11.4 | 12.0 | 29 | 4,259 | 5.89 |
| P1 | 41 | 132 | 28 | 160 | 3.9 | 3.0 | 18 | 16,194 | 0.99 |
| P27 | 14 | 59 | 94 | 153 | 10.9 | 10.5 | 24 | 886 | 17.27 |
| P3 | 11 | 138 | 14 | 152 | 13.8 | 13.0 | 26 | 3,721 | 4.08 |
| P16 | 41 | 79 | 72 | 151 | 3.7 | 3.0 | 11 | 7,548 | 2.00 |
| P22 | 17 | 148 | 1 | 149 | 8.8 | 8.0 | 27 | 3,046 | 4.89 |
| P14 | 17 | 111 | 8 | 119 | 7.0 | 7.0 | 20 | 6,100 | 1.95 |
| P7 | 23 | 87 | 3 | 90 | 3.9 | 3.0 | 17 | 7,962 | 1.13 |
| P29 | 7 | 87 | 1 | 88 | 12.6 | 10.0 | 31 | 1,689 | 5.21 |
| P25 | 21 | 51 | 17 | 68 | 3.2 | 3.0 | 8 | 7,628 | 0.89 |
| P26 | 18 | 43 | 6 | 49 | 2.7 | 1.0 | 10 | 9,542 | 0.51 |
| P30 | 5 | 9 | 18 | 27 | 5.4 | 7.0 | 10 | 583 | 4.63 |
| P15 | 19 | 24 | 1 | 25 | 1.3 | 0.0 | 5 | 3,100 | 0.81 |
| P31 | 7 | 16 | 0 | 16 | 2.3 | 0.0 | 14 | 508 | 3.15 |
| P32 | 3 | 6 | 8 | 14 | 4.7 | 6.0 | 8 | 306 | 4.58 |
NoteInterpretation
This table shows each pathologist’s consultation activity during their period of active employment, counted as unique cases. “Cases Asked” is the number of distinct cases for which they requested a colleague’s opinion, and “Cases Answered” is the number of distinct cases for which they provided one. The “Rate/100 Cases” column normalizes consultation activity against each pathologist’s total reported caseload, allowing fair comparison between high-volume and low-volume pathologists.
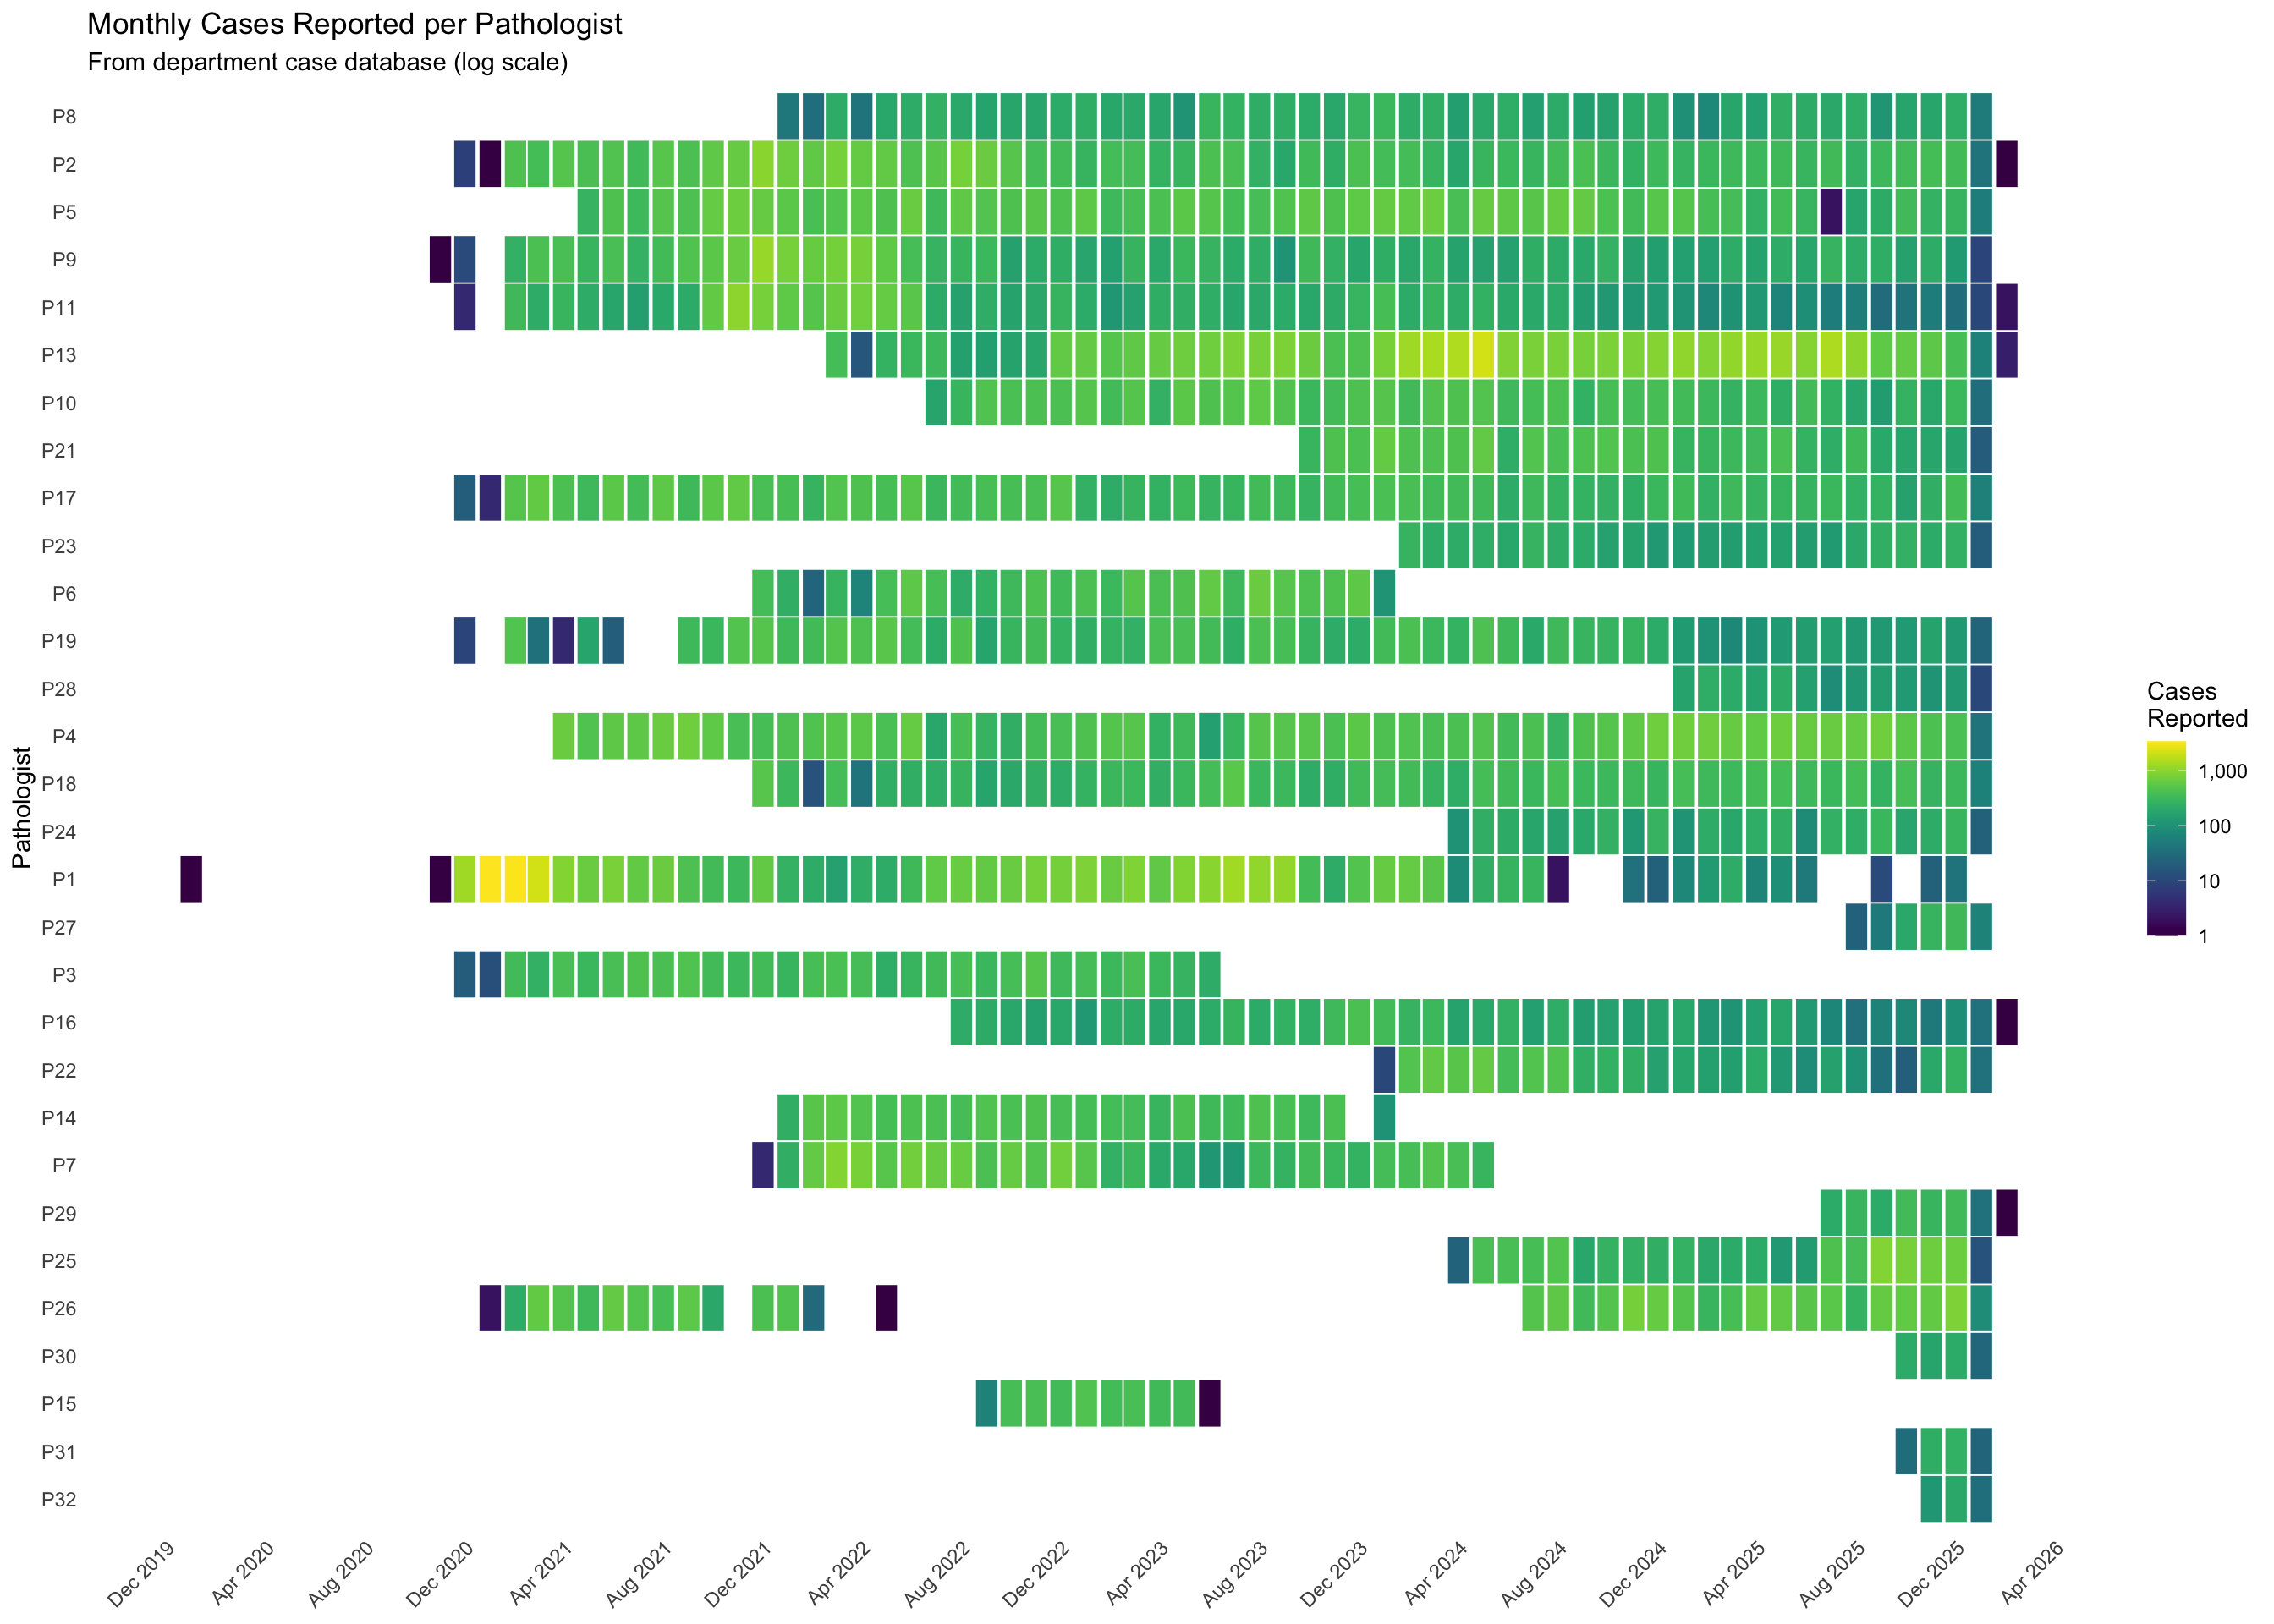
15.4 Department Cases per Pathologist from External Data
15.5 Per-Pathologist Consultation Rate (% of Cases)
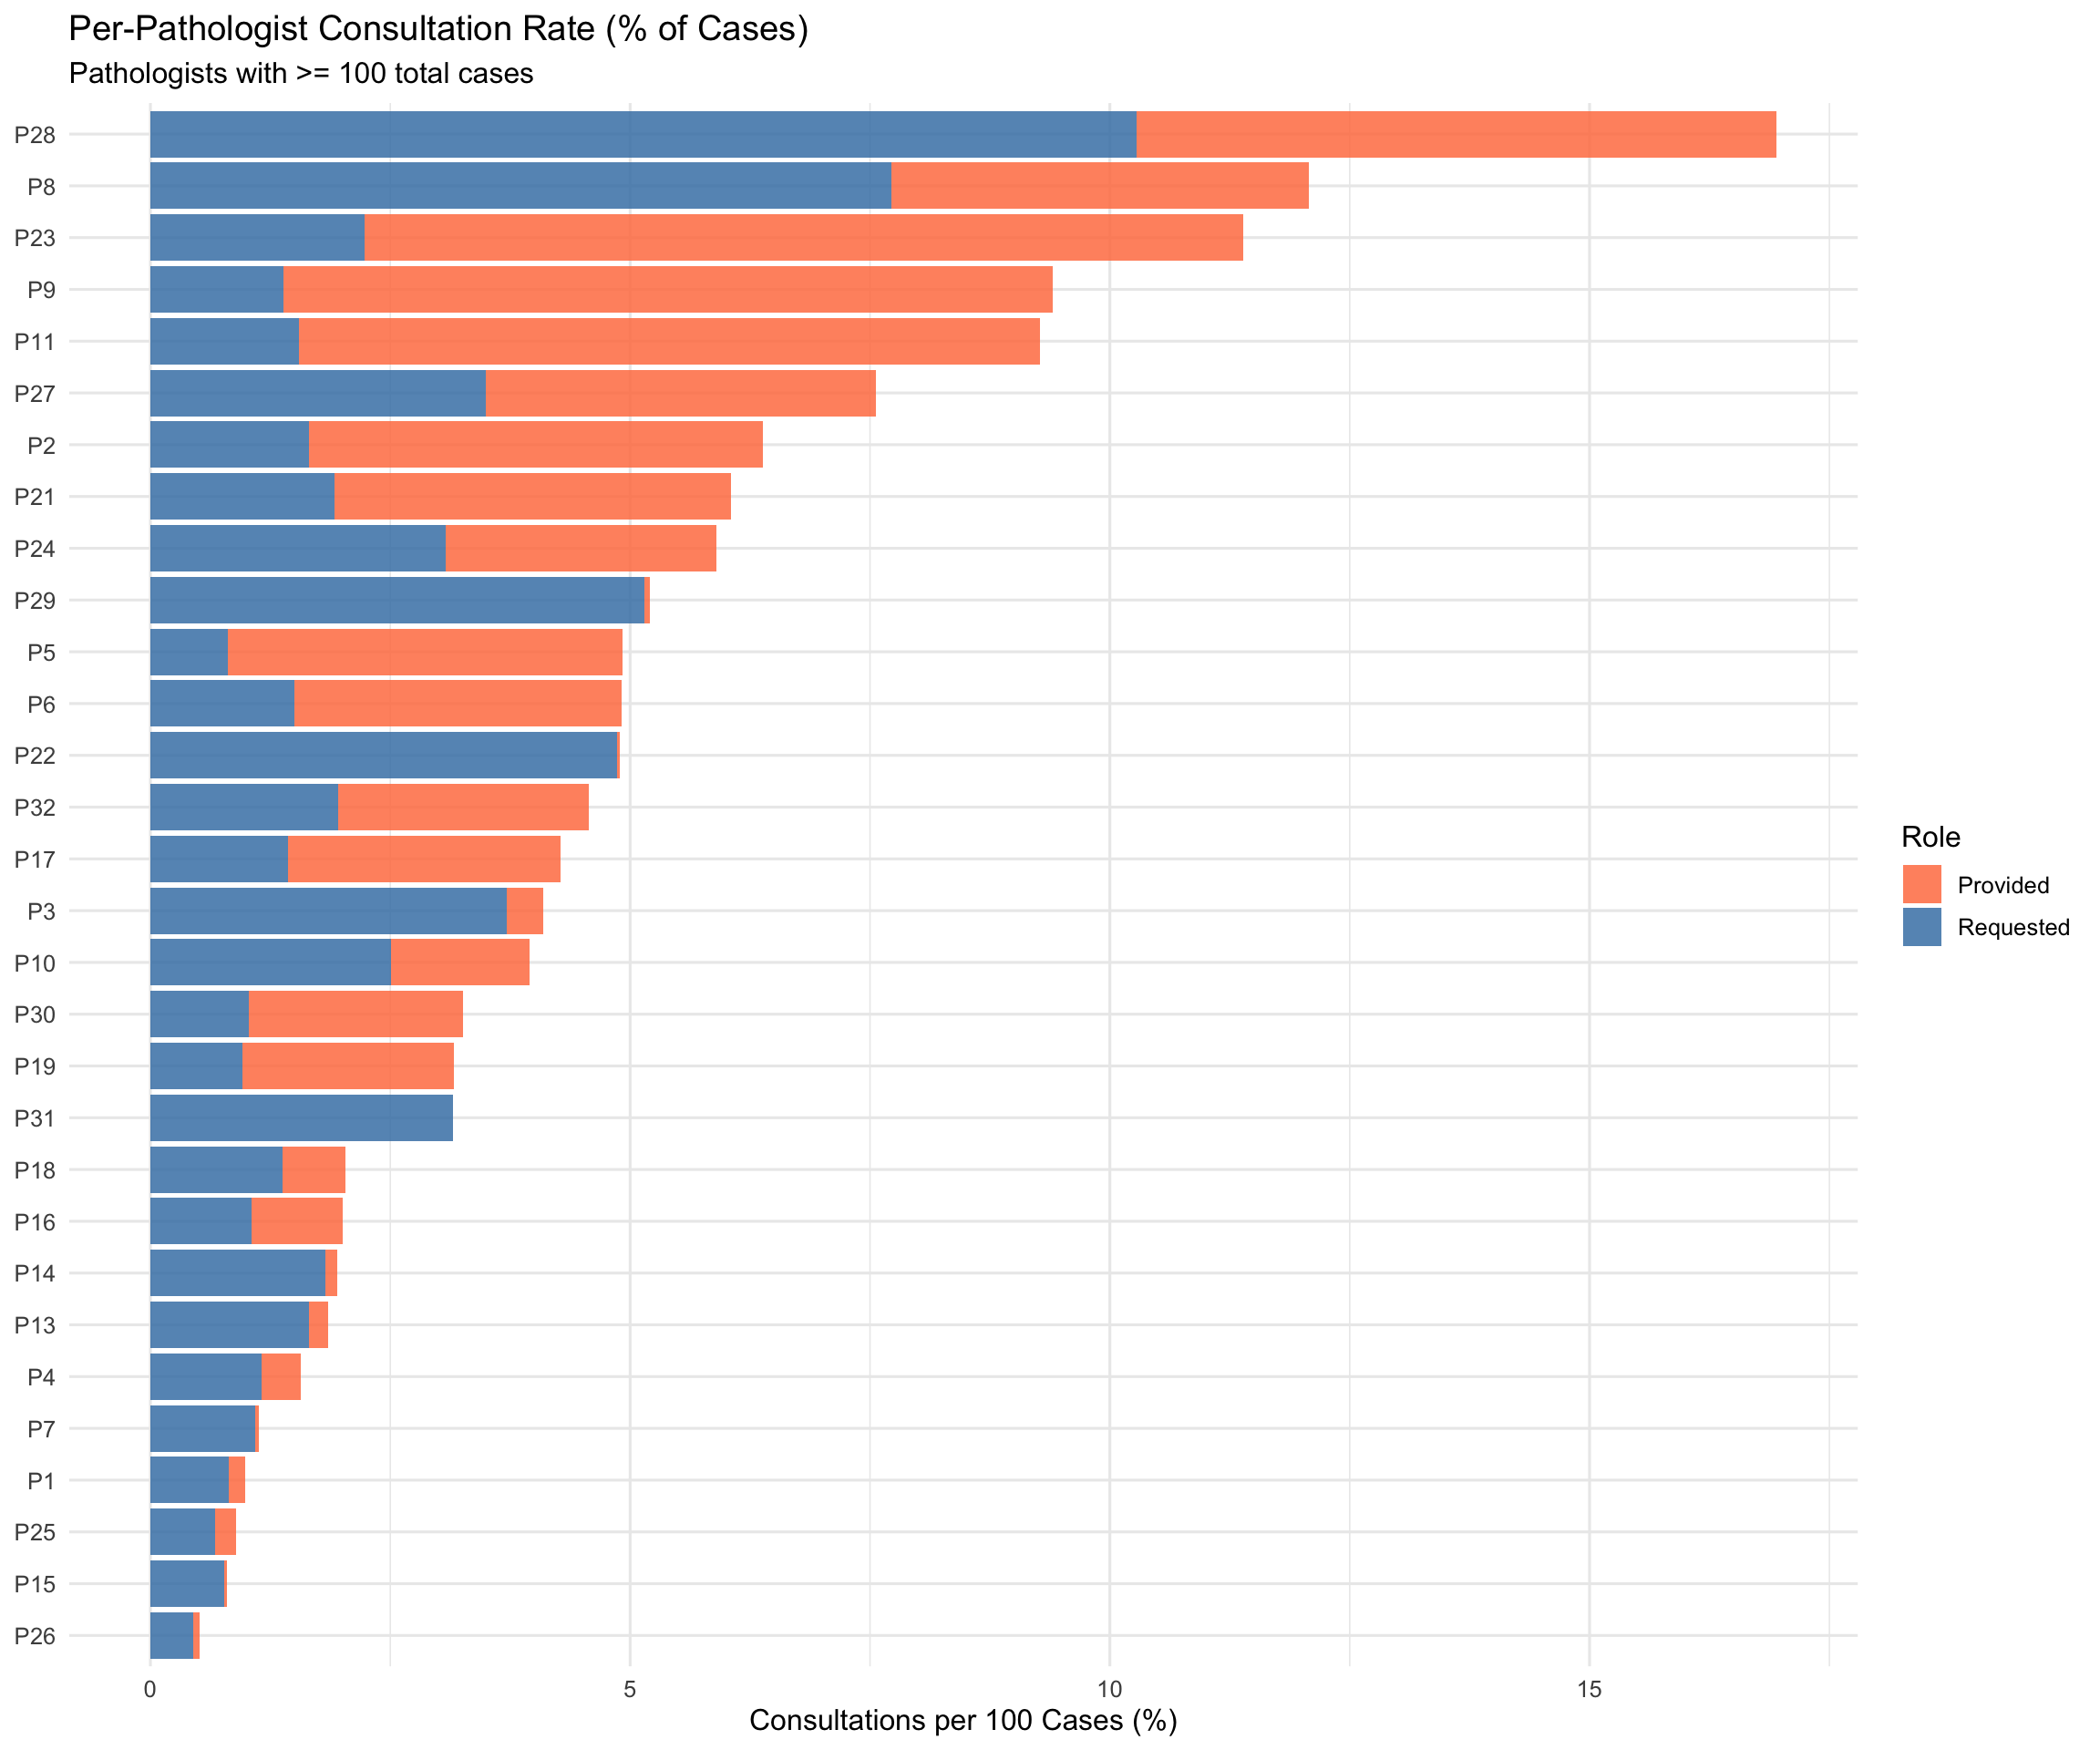
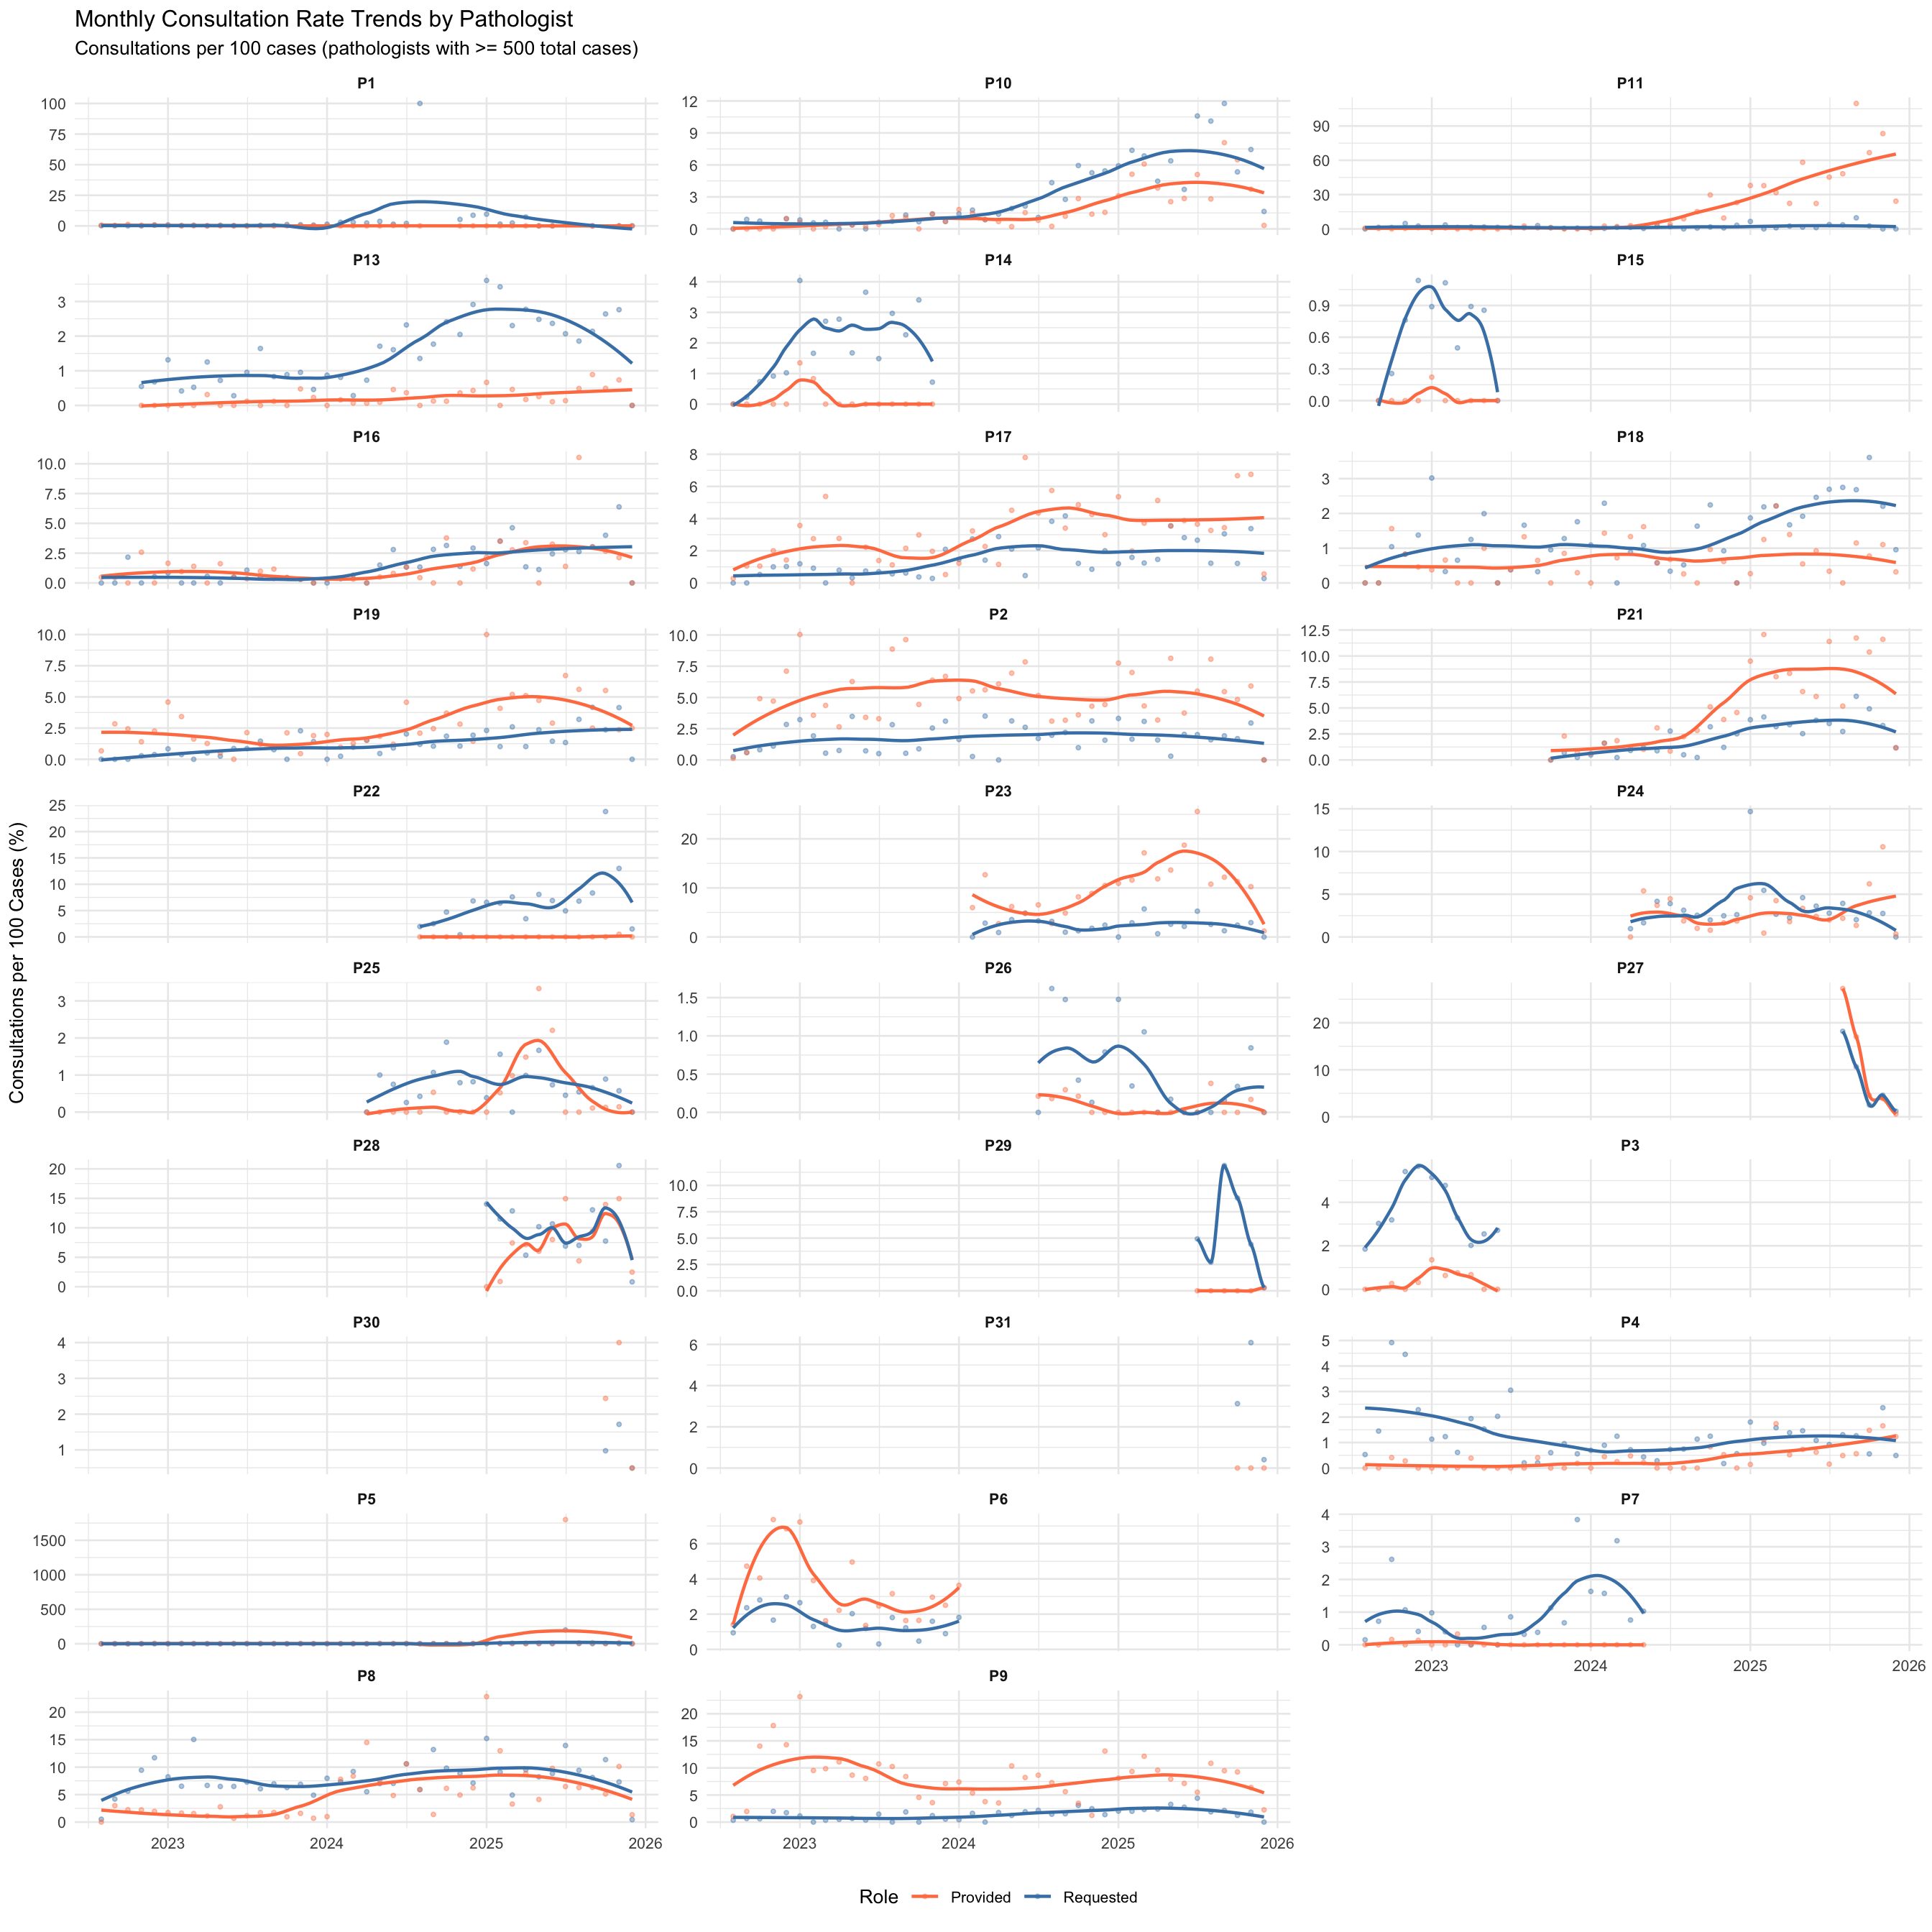
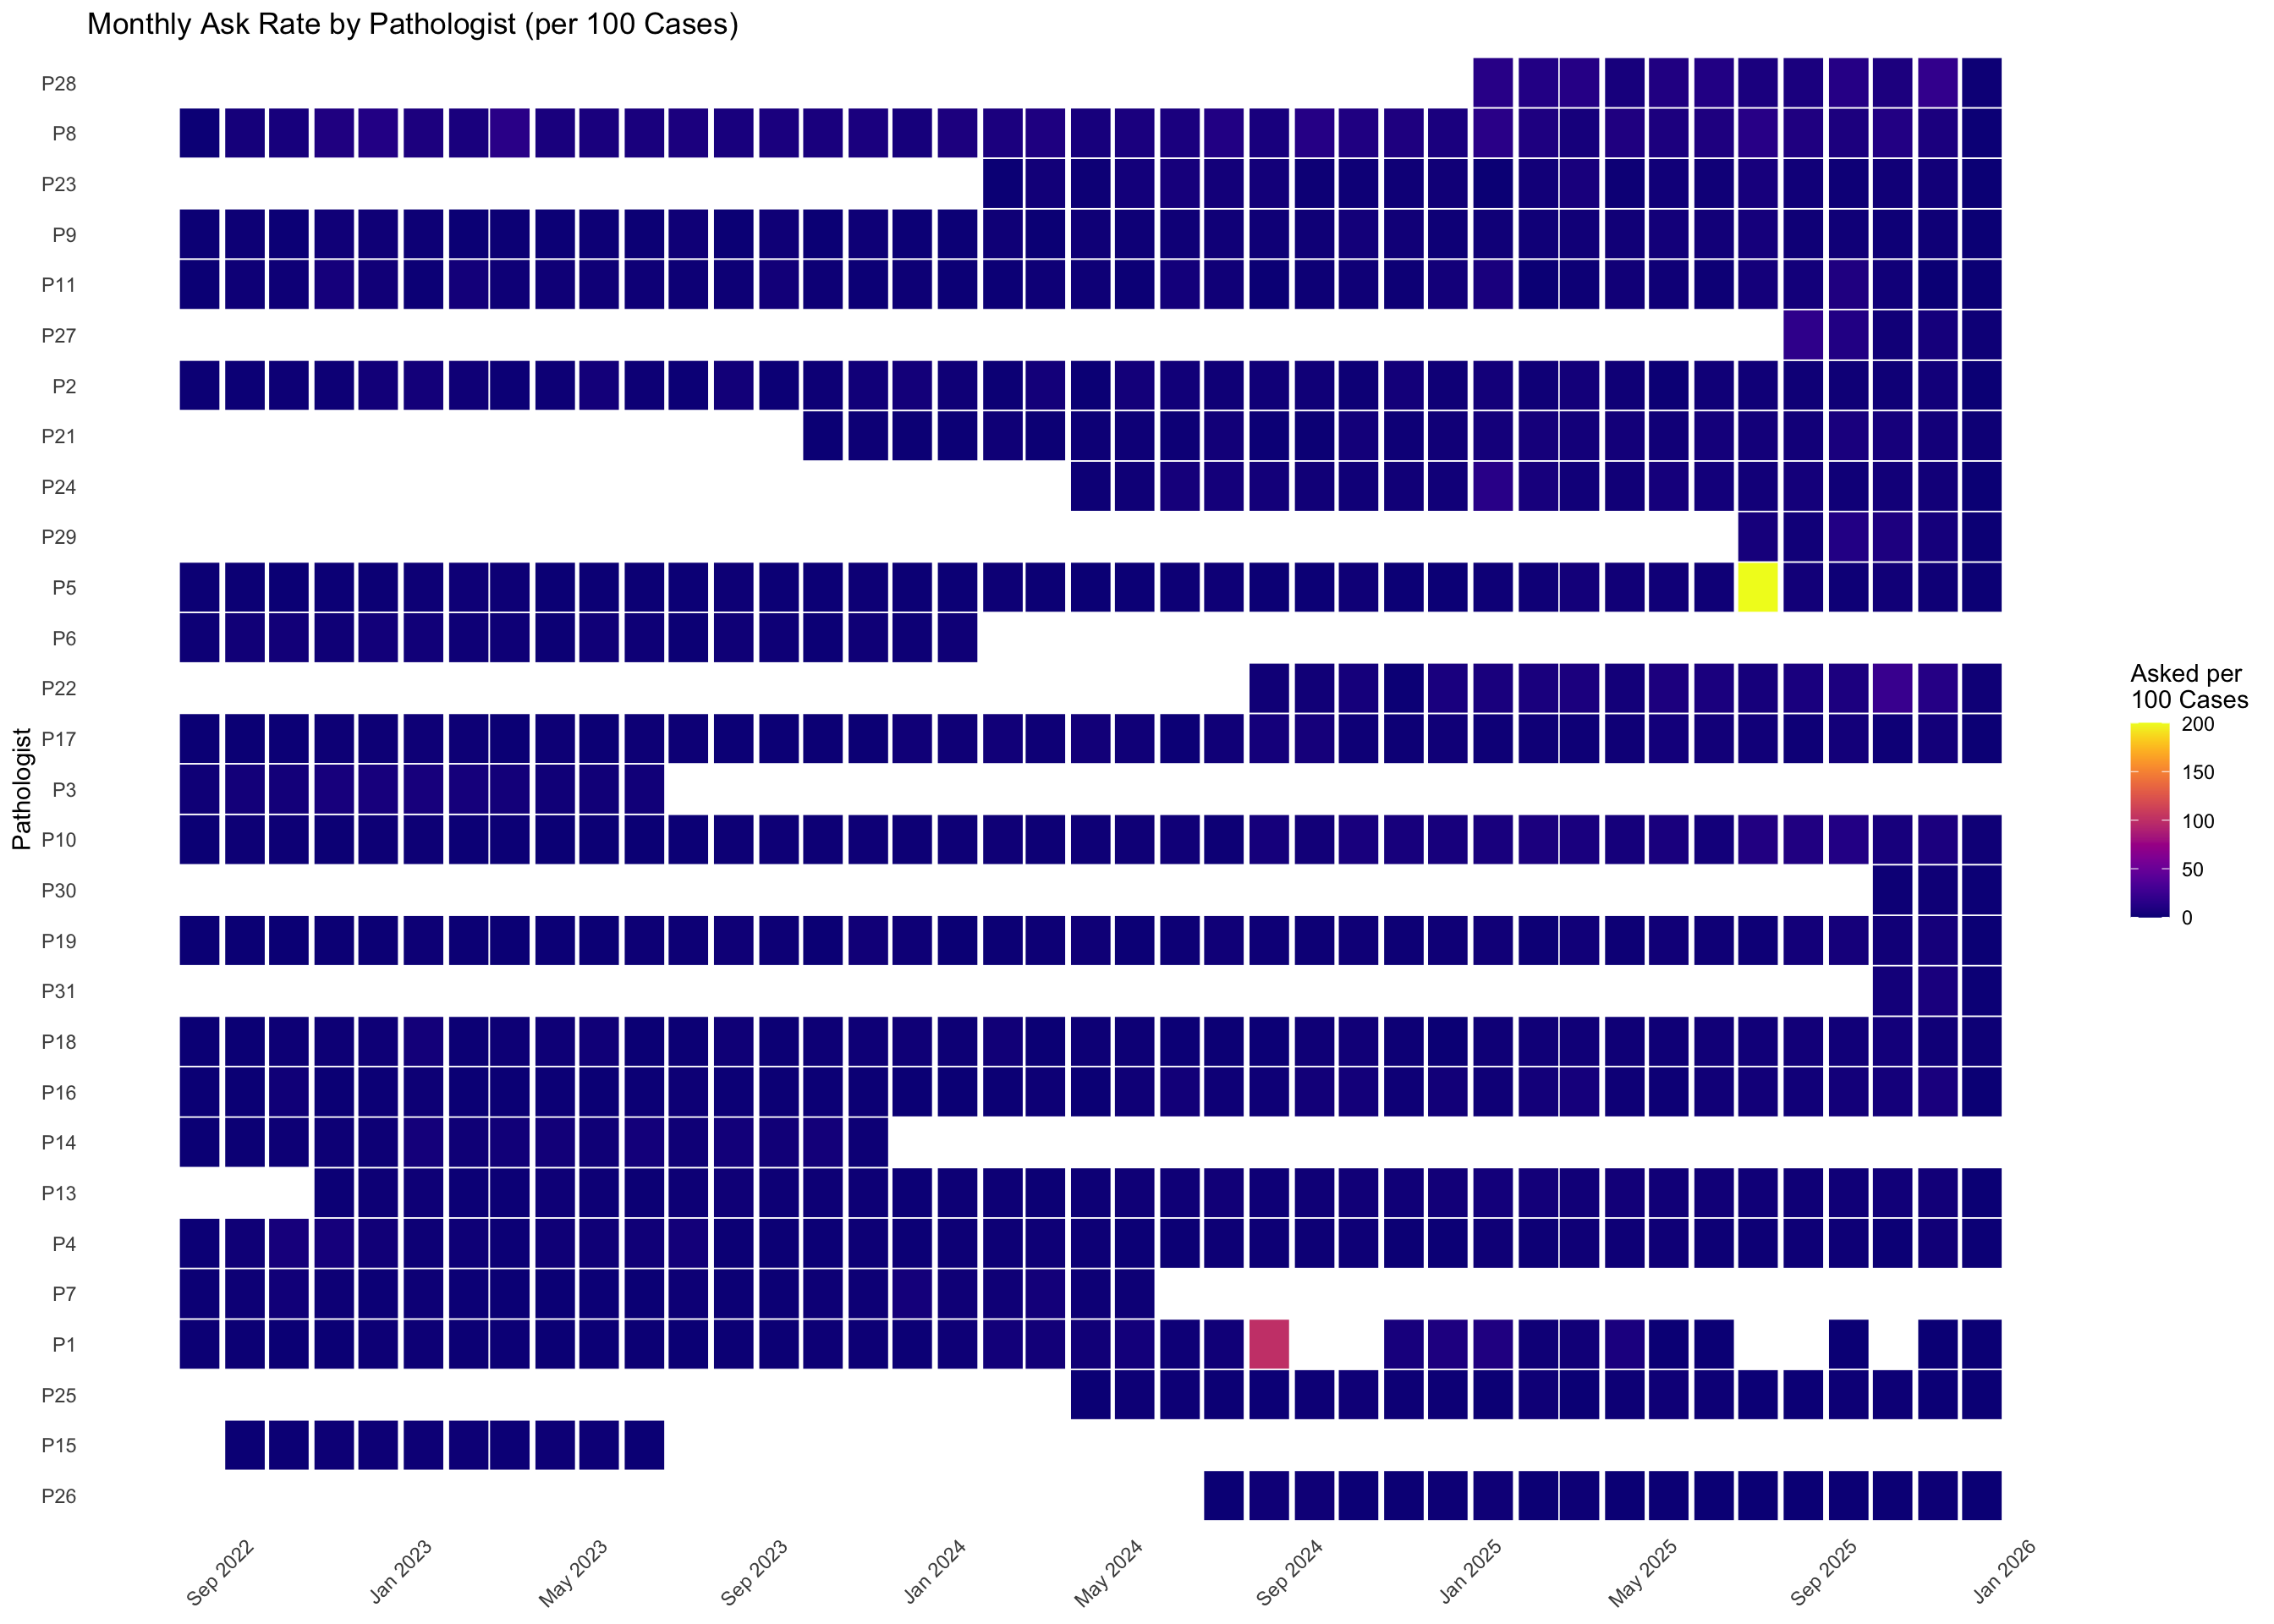
For each pathologist, what fraction of their total reported cases resulted in a consultation — either requested (asked) or provided (answered)? This reveals individual consultation behaviour and how it evolves over time.
| Pathologist | Active Months | Total Cases | Cases Asked | Cases Answered | Total Consultation Cases | Ask Rate (%) | Answer Rate (%) | Overall Rate (%) |
|---|---|---|---|---|---|---|---|---|
| P28 | 12 | 1,829 | 188 | 122 | 310 | 10.28 | 6.67 | 16.95 |
| P8 | 41 | 8,005 | 618 | 348 | 966 | 7.72 | 4.35 | 12.07 |
| P23 | 23 | 4,401 | 98 | 403 | 501 | 2.23 | 9.16 | 11.38 |
| P9 | 41 | 8,557 | 119 | 685 | 804 | 1.39 | 8.01 | 9.40 |
| P11 | 41 | 6,759 | 105 | 522 | 627 | 1.55 | 7.72 | 9.28 |
| P27 | 5 | 886 | 31 | 36 | 67 | 3.50 | 4.06 | 7.56 |
| P2 | 41 | 13,975 | 230 | 661 | 891 | 1.65 | 4.73 | 6.38 |
| P21 | 27 | 9,651 | 185 | 399 | 584 | 1.92 | 4.13 | 6.05 |
| P24 | 21 | 4,259 | 131 | 120 | 251 | 3.08 | 2.82 | 5.89 |
| P29 | 6 | 1,689 | 87 | 1 | 88 | 5.15 | 0.06 | 5.21 |
| P5 | 41 | 17,800 | 145 | 731 | 876 | 0.81 | 4.11 | 4.92 |
| P6 | 18 | 7,208 | 108 | 246 | 354 | 1.50 | 3.41 | 4.91 |
| P22 | 17 | 3,046 | 148 | 1 | 149 | 4.86 | 0.03 | 4.89 |
| P32 | 2 | 306 | 6 | 8 | 14 | 1.96 | 2.61 | 4.58 |
| P17 | 41 | 12,579 | 180 | 357 | 537 | 1.43 | 2.84 | 4.27 |
| P3 | 11 | 3,721 | 138 | 14 | 152 | 3.71 | 0.38 | 4.08 |
| P10 | 41 | 14,948 | 375 | 215 | 590 | 2.51 | 1.44 | 3.95 |
| P30 | 3 | 583 | 6 | 13 | 19 | 1.03 | 2.23 | 3.26 |
| P19 | 41 | 10,324 | 99 | 227 | 326 | 0.96 | 2.20 | 3.16 |
| P31 | 3 | 508 | 16 | 0 | 16 | 3.15 | 0.00 | 3.15 |
| P18 | 41 | 12,616 | 174 | 82 | 256 | 1.38 | 0.65 | 2.03 |
| P16 | 41 | 7,548 | 79 | 72 | 151 | 1.05 | 0.95 | 2.00 |
| P14 | 16 | 6,100 | 111 | 8 | 119 | 1.82 | 0.13 | 1.95 |
| P13 | 38 | 32,321 | 533 | 66 | 599 | 1.65 | 0.20 | 1.85 |
| P4 | 41 | 19,255 | 223 | 79 | 302 | 1.16 | 0.41 | 1.57 |
| P7 | 22 | 7,962 | 87 | 3 | 90 | 1.09 | 0.04 | 1.13 |
| P1 | 36 | 16,194 | 132 | 28 | 160 | 0.82 | 0.17 | 0.99 |
| P25 | 21 | 7,628 | 51 | 17 | 68 | 0.67 | 0.22 | 0.89 |
| P15 | 10 | 3,100 | 24 | 1 | 25 | 0.77 | 0.03 | 0.81 |
| P26 | 18 | 9,542 | 43 | 6 | 49 | 0.45 | 0.06 | 0.51 |
NoteInterpretation
This table expresses consultation activity as a percentage of each pathologist’s total caseload, using unique case counts. The “Ask Rate” shows what fraction of their cases prompted them to seek a second opinion, while the “Answer Rate” shows how often they served as the consulted expert relative to their caseload. These percentage-based rates control for differences in overall workload, revealing individual consultation behavior independent of case volume.
15.5.1 Monthly Consultation Rate Trends by Pathologist
15.5.2 Pathologist Consultation Behaviour Heatmap
15.5.3 Yearly Pathologist Consultation Rate
| Pathologist | 2022 | 2023 | 2024 | 2025 | Total_Cases | Overall_Rate_Pct |
|---|---|---|---|---|---|---|
| P28 | NA | NA | NA | 10.28 | 1,829 | 16.95 |
| P8 | 6.41 | 7.21 | 8.14 | 8.45 | 8,005 | 12.07 |
| P23 | NA | NA | 2.24 | 2.22 | 4,401 | 11.38 |
| P9 | 1.01 | 0.60 | 1.56 | 2.34 | 8,557 | 9.40 |
| P11 | 2.05 | 1.34 | 1.22 | 2.53 | 6,759 | 9.28 |
| P27 | NA | NA | NA | 3.50 | 886 | 7.56 |
| P2 | 0.91 | 1.71 | 1.91 | 1.84 | 13,975 | 6.38 |
| P21 | NA | 0.35 | 1.33 | 3.49 | 9,651 | 6.05 |
| P24 | NA | NA | 2.65 | 3.37 | 4,259 | 5.89 |
| P29 | NA | NA | NA | 5.15 | 1,689 | 5.21 |
| P5 | 0.25 | 0.57 | 0.61 | 2.00 | 17,800 | 4.92 |
| P6 | 2.20 | 1.30 | 1.82 | NA | 7,208 | 4.91 |
| P22 | NA | NA | 2.87 | 6.47 | 3,046 | 4.89 |
| P32 | NA | NA | NA | 1.96 | 306 | 4.58 |
| P17 | 0.55 | 0.73 | 2.14 | 1.93 | 12,579 | 4.27 |
| P3 | 3.89 | 3.53 | NA | NA | 3,721 | 4.08 |
| P10 | 0.61 | 0.66 | 2.79 | 6.28 | 14,948 | 3.95 |
| P30 | NA | NA | NA | 1.03 | 583 | 3.26 |
| P19 | 0.13 | 0.77 | 0.98 | 2.23 | 10,324 | 3.16 |
| P31 | NA | NA | NA | 3.15 | 508 | 3.15 |
| P18 | 0.63 | 1.05 | 0.99 | 2.28 | 12,616 | 2.03 |
| P16 | 0.52 | 0.35 | 1.34 | 2.41 | 7,548 | 2.00 |
| P14 | 0.58 | 2.45 | NA | NA | 6,100 | 1.95 |
| P13 | 0.65 | 0.88 | 1.47 | 2.48 | 32,321 | 1.85 |
| P4 | 2.60 | 0.98 | 0.72 | 1.27 | 19,255 | 1.57 |
| P7 | 0.97 | 0.82 | 1.73 | NA | 7,962 | 1.13 |
| P1 | 0.20 | 0.40 | 2.53 | 2.73 | 16,194 | 0.99 |
| P25 | NA | NA | 0.80 | 0.60 | 7,628 | 0.89 |
| P15 | 0.67 | 0.84 | NA | NA | 3,100 | 0.81 |
| P26 | NA | NA | 0.68 | 0.33 | 9,542 | 0.51 |
15.6 Consultation Rate by Biopsy Section
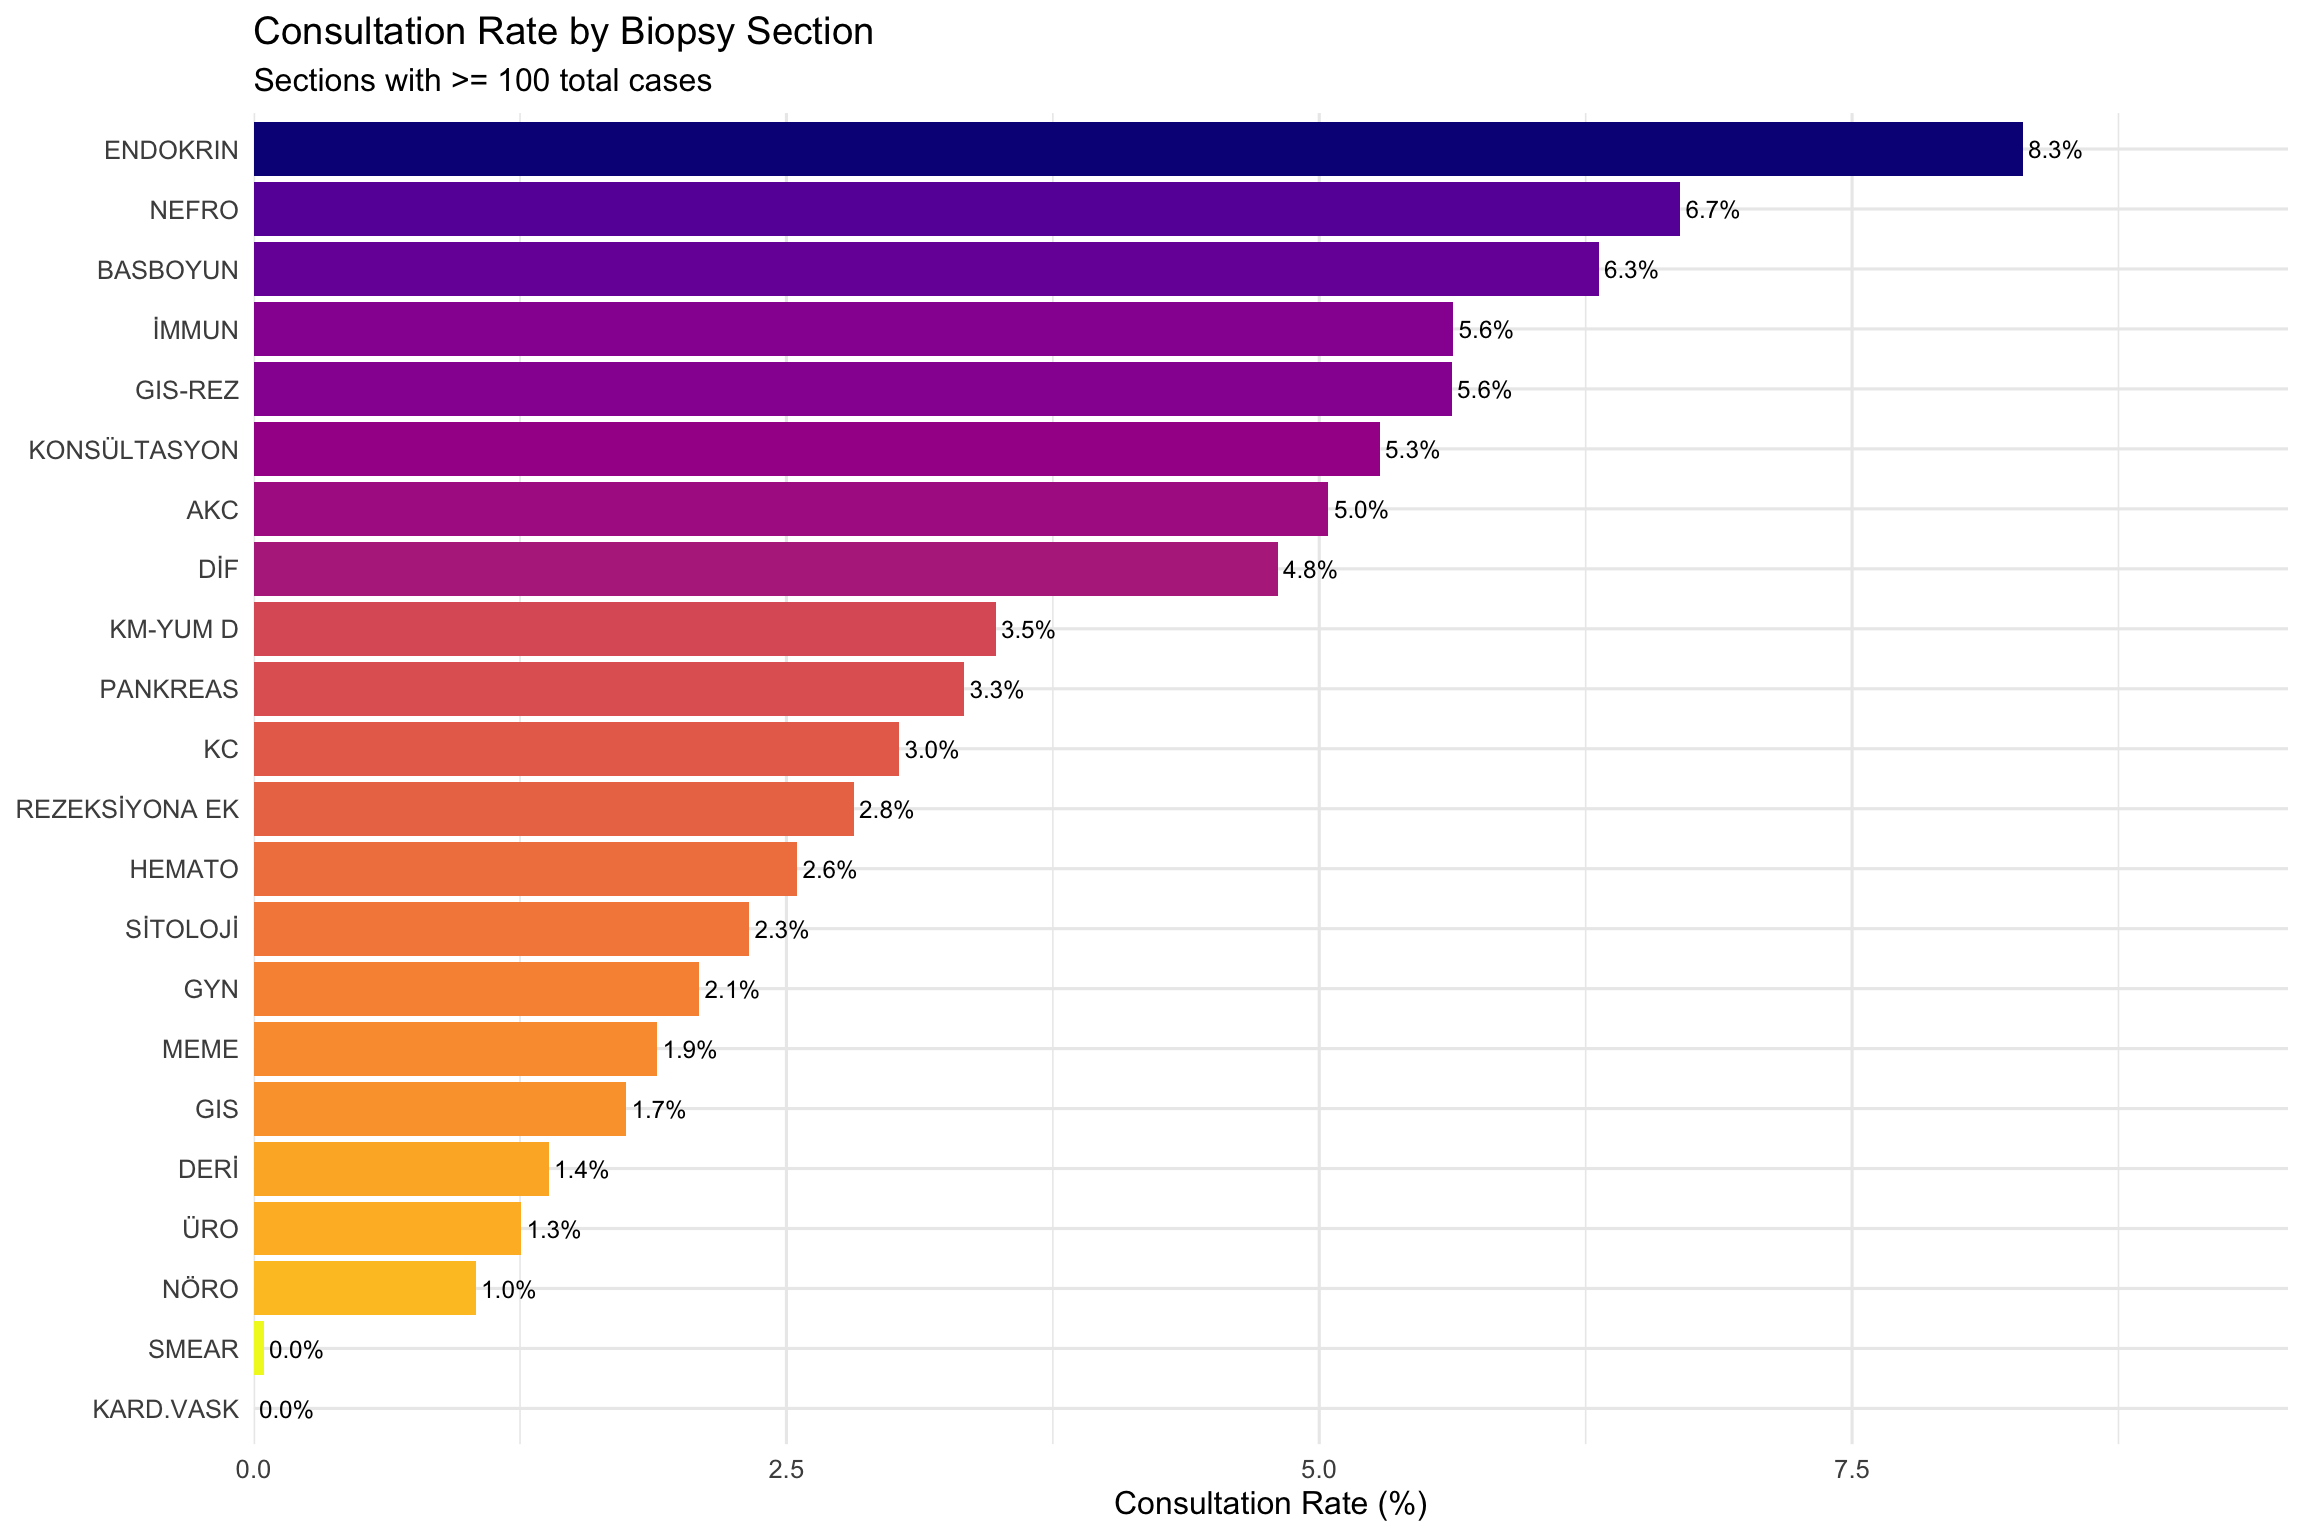
By joining the section (biopsy workstation) assignment data with consultation records, we can determine which biopsy sections generate consultations most frequently.
Of the 4532 unique consultation Case IDs, 96.2% match the section database. Auxiliary sections (Immun, Histo, Frozen, Sitoloji, Rezeksiyona Ek, Konsültasyon, Genetik, DIF) are excluded when a case also belongs to a primary section — this removed 69,003 auxiliary-only rows, ensuring cases are counted under their primary workstation.
| Section | Total Cases | Cases with Consultation | Consultation Rate (%) |
|---|---|---|---|
| ENDOKRIN | 2,542 | 211 | 8.30 |
| NEFRO | 508 | 34 | 6.69 |
| BASBOYUN | 3,692 | 233 | 6.31 |
| İMMUN | 46,025 | 2,591 | 5.63 |
| GIS-REZ | 2,828 | 159 | 5.62 |
| KONSÜLTASYON | 2,460 | 130 | 5.28 |
| AKC | 3,351 | 169 | 5.04 |
| DİF | 562 | 27 | 4.80 |
| HISTO | 21 | 1 | 4.76 |
| KM-YUM D | 9,421 | 328 | 3.48 |
| PANKREAS | 480 | 16 | 3.33 |
| KC | 4,094 | 124 | 3.03 |
| REZEKSİYONA EK | 23,476 | 661 | 2.82 |
| HEMATO | 9,764 | 249 | 2.55 |
| SİTOLOJİ | 11,573 | 269 | 2.32 |
| GYN | 29,129 | 609 | 2.09 |
| MEME | 9,085 | 172 | 1.89 |
| GIS | 86,997 | 1,520 | 1.75 |
| FROZEN | 72 | 1 | 1.39 |
| DERİ | 18,266 | 253 | 1.39 |
| ÜRO | 8,048 | 101 | 1.25 |
| PRENATAL | 84 | 1 | 1.19 |
| NÖRO | 4,124 | 43 | 1.04 |
| GENETIK | 675 | 1 | 0.15 |
| SMEAR | 116,620 | 55 | 0.05 |
| KARD.VASK | 106 | 0 | 0.00 |
NoteInterpretation
This table shows what percentage of cases from each biopsy section (workstation) led to a consultation. Sections with higher rates handle case types that more frequently require a second opinion – this typically reflects greater diagnostic complexity or subspecialty overlap rather than individual pathologist uncertainty.
Note: The KONSULTASYON section represents cases that were explicitly routed through the consultation workflow — its high rate is expected by definition.
15.6.1 Section Volume vs Consultation Rate
15.7 Consultation Rate by Section Over Time
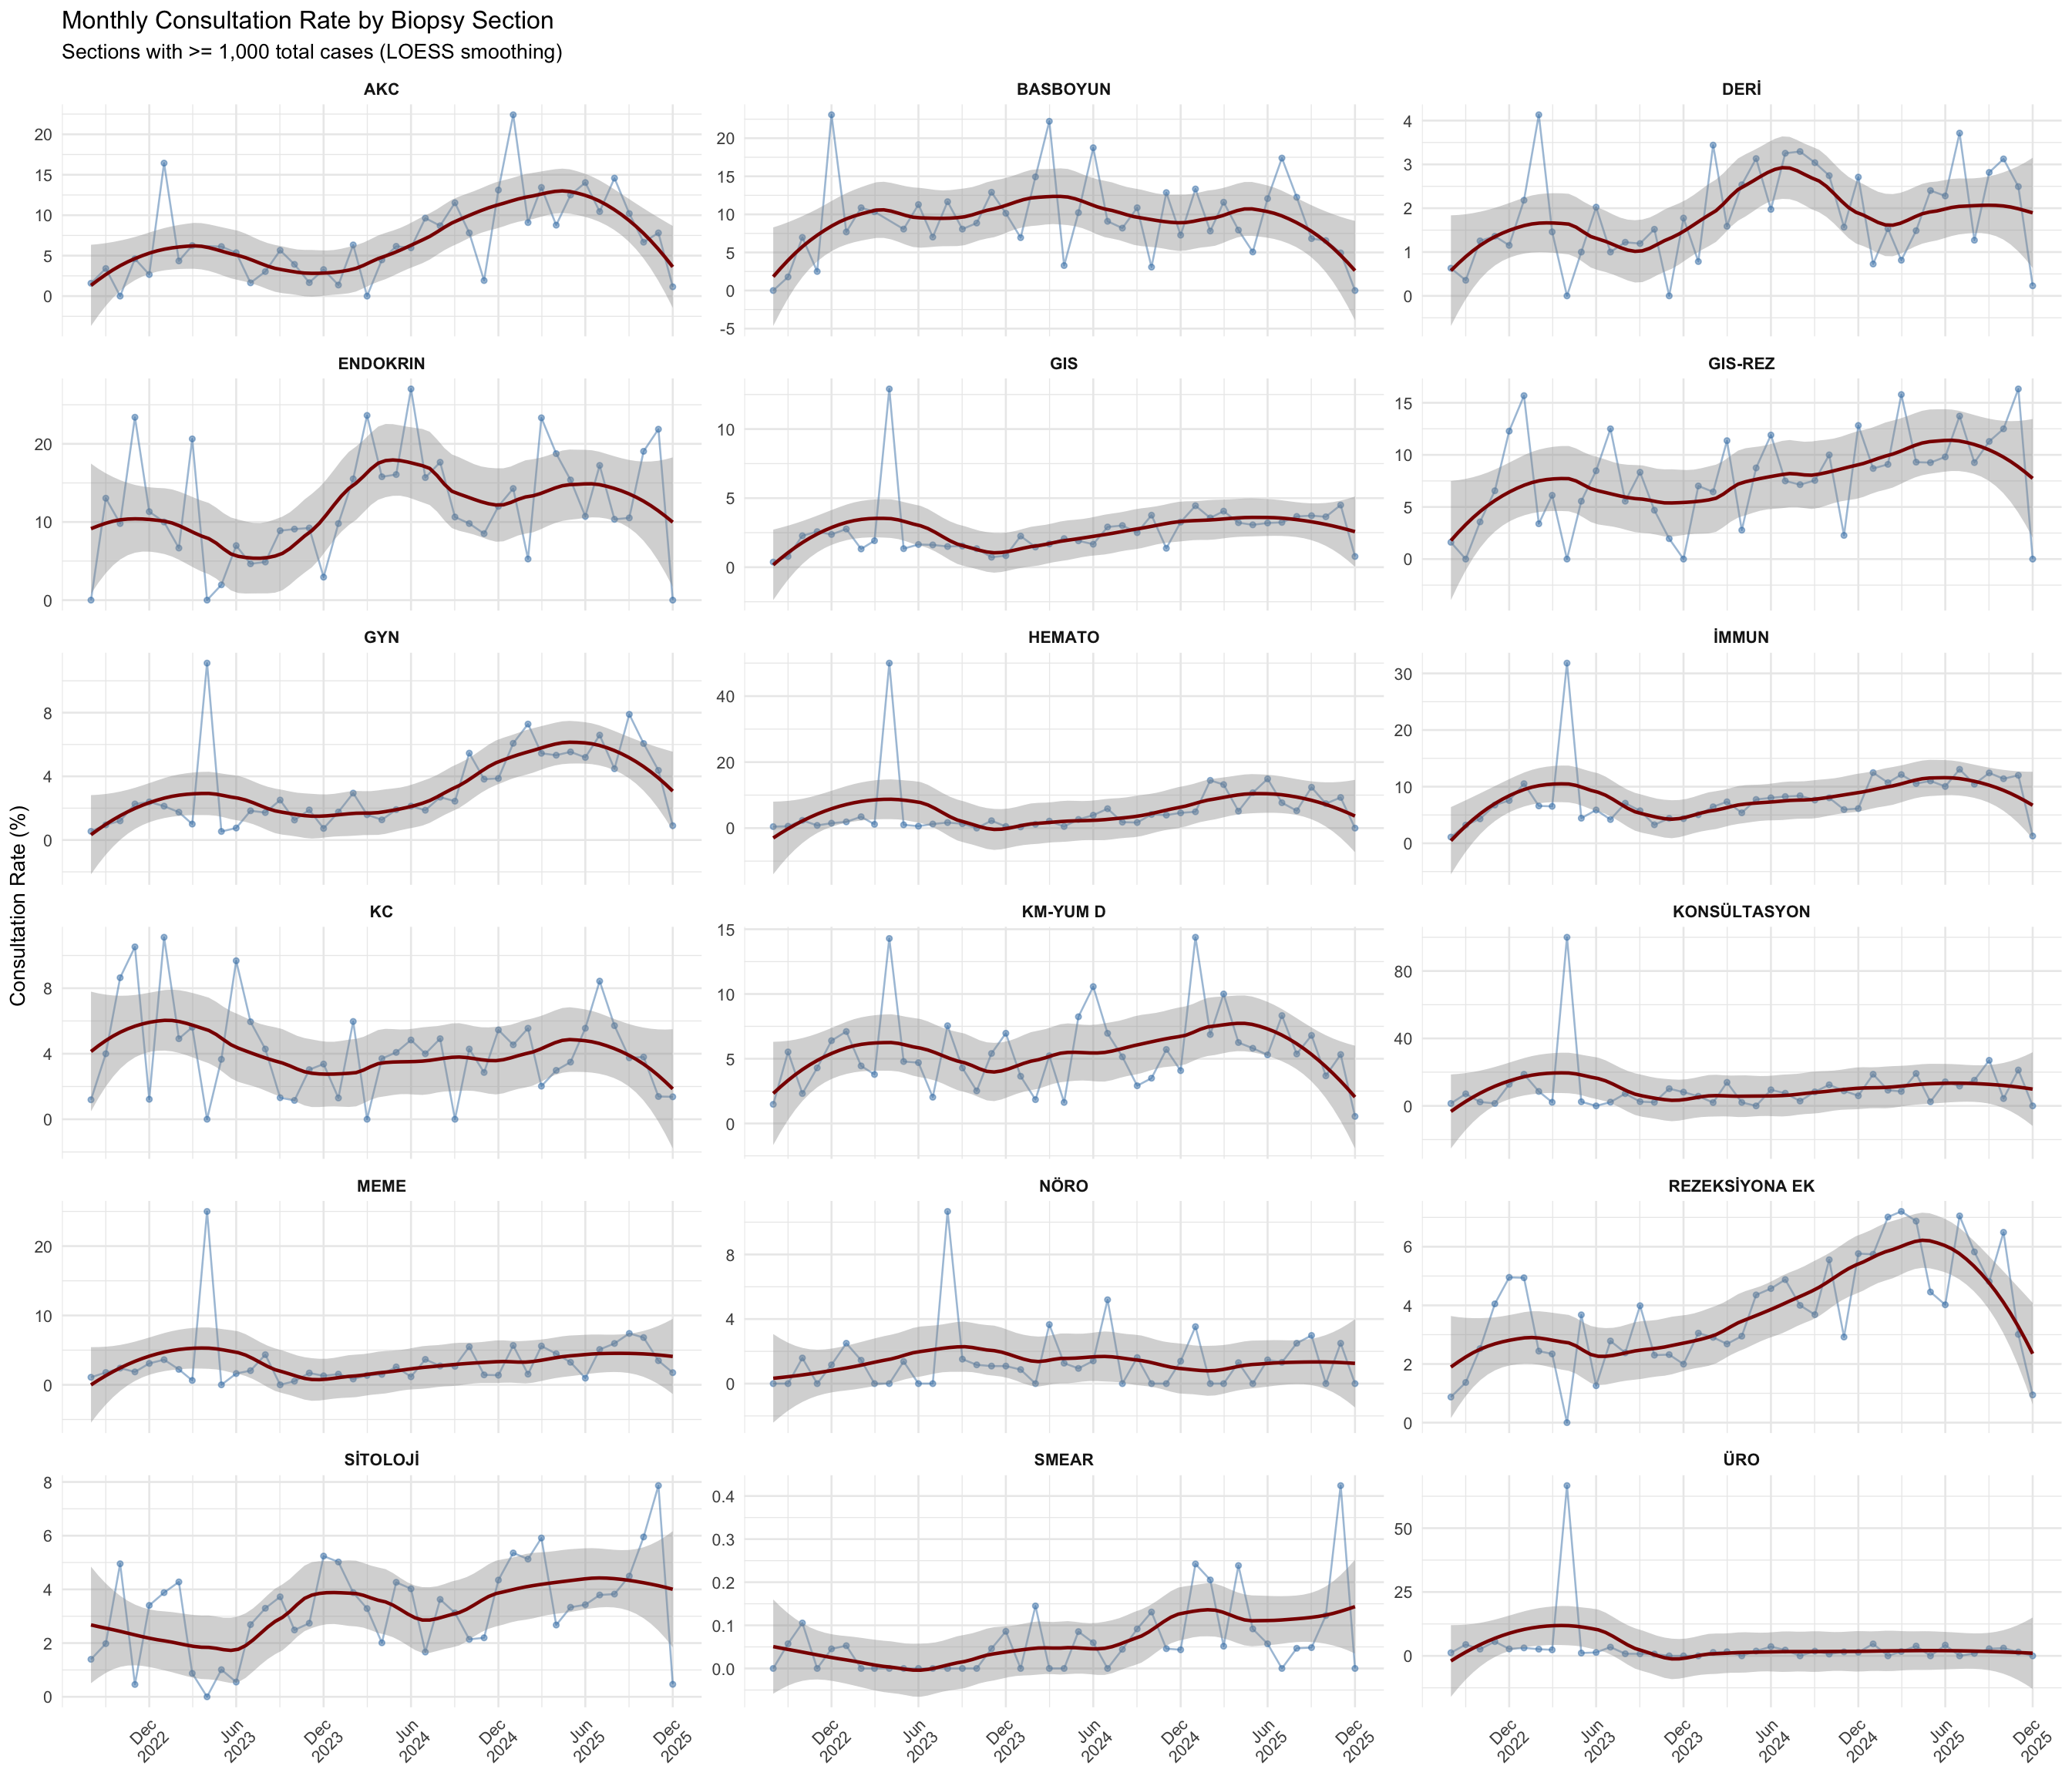
15.7.1 Monthly Trends for Major Sections
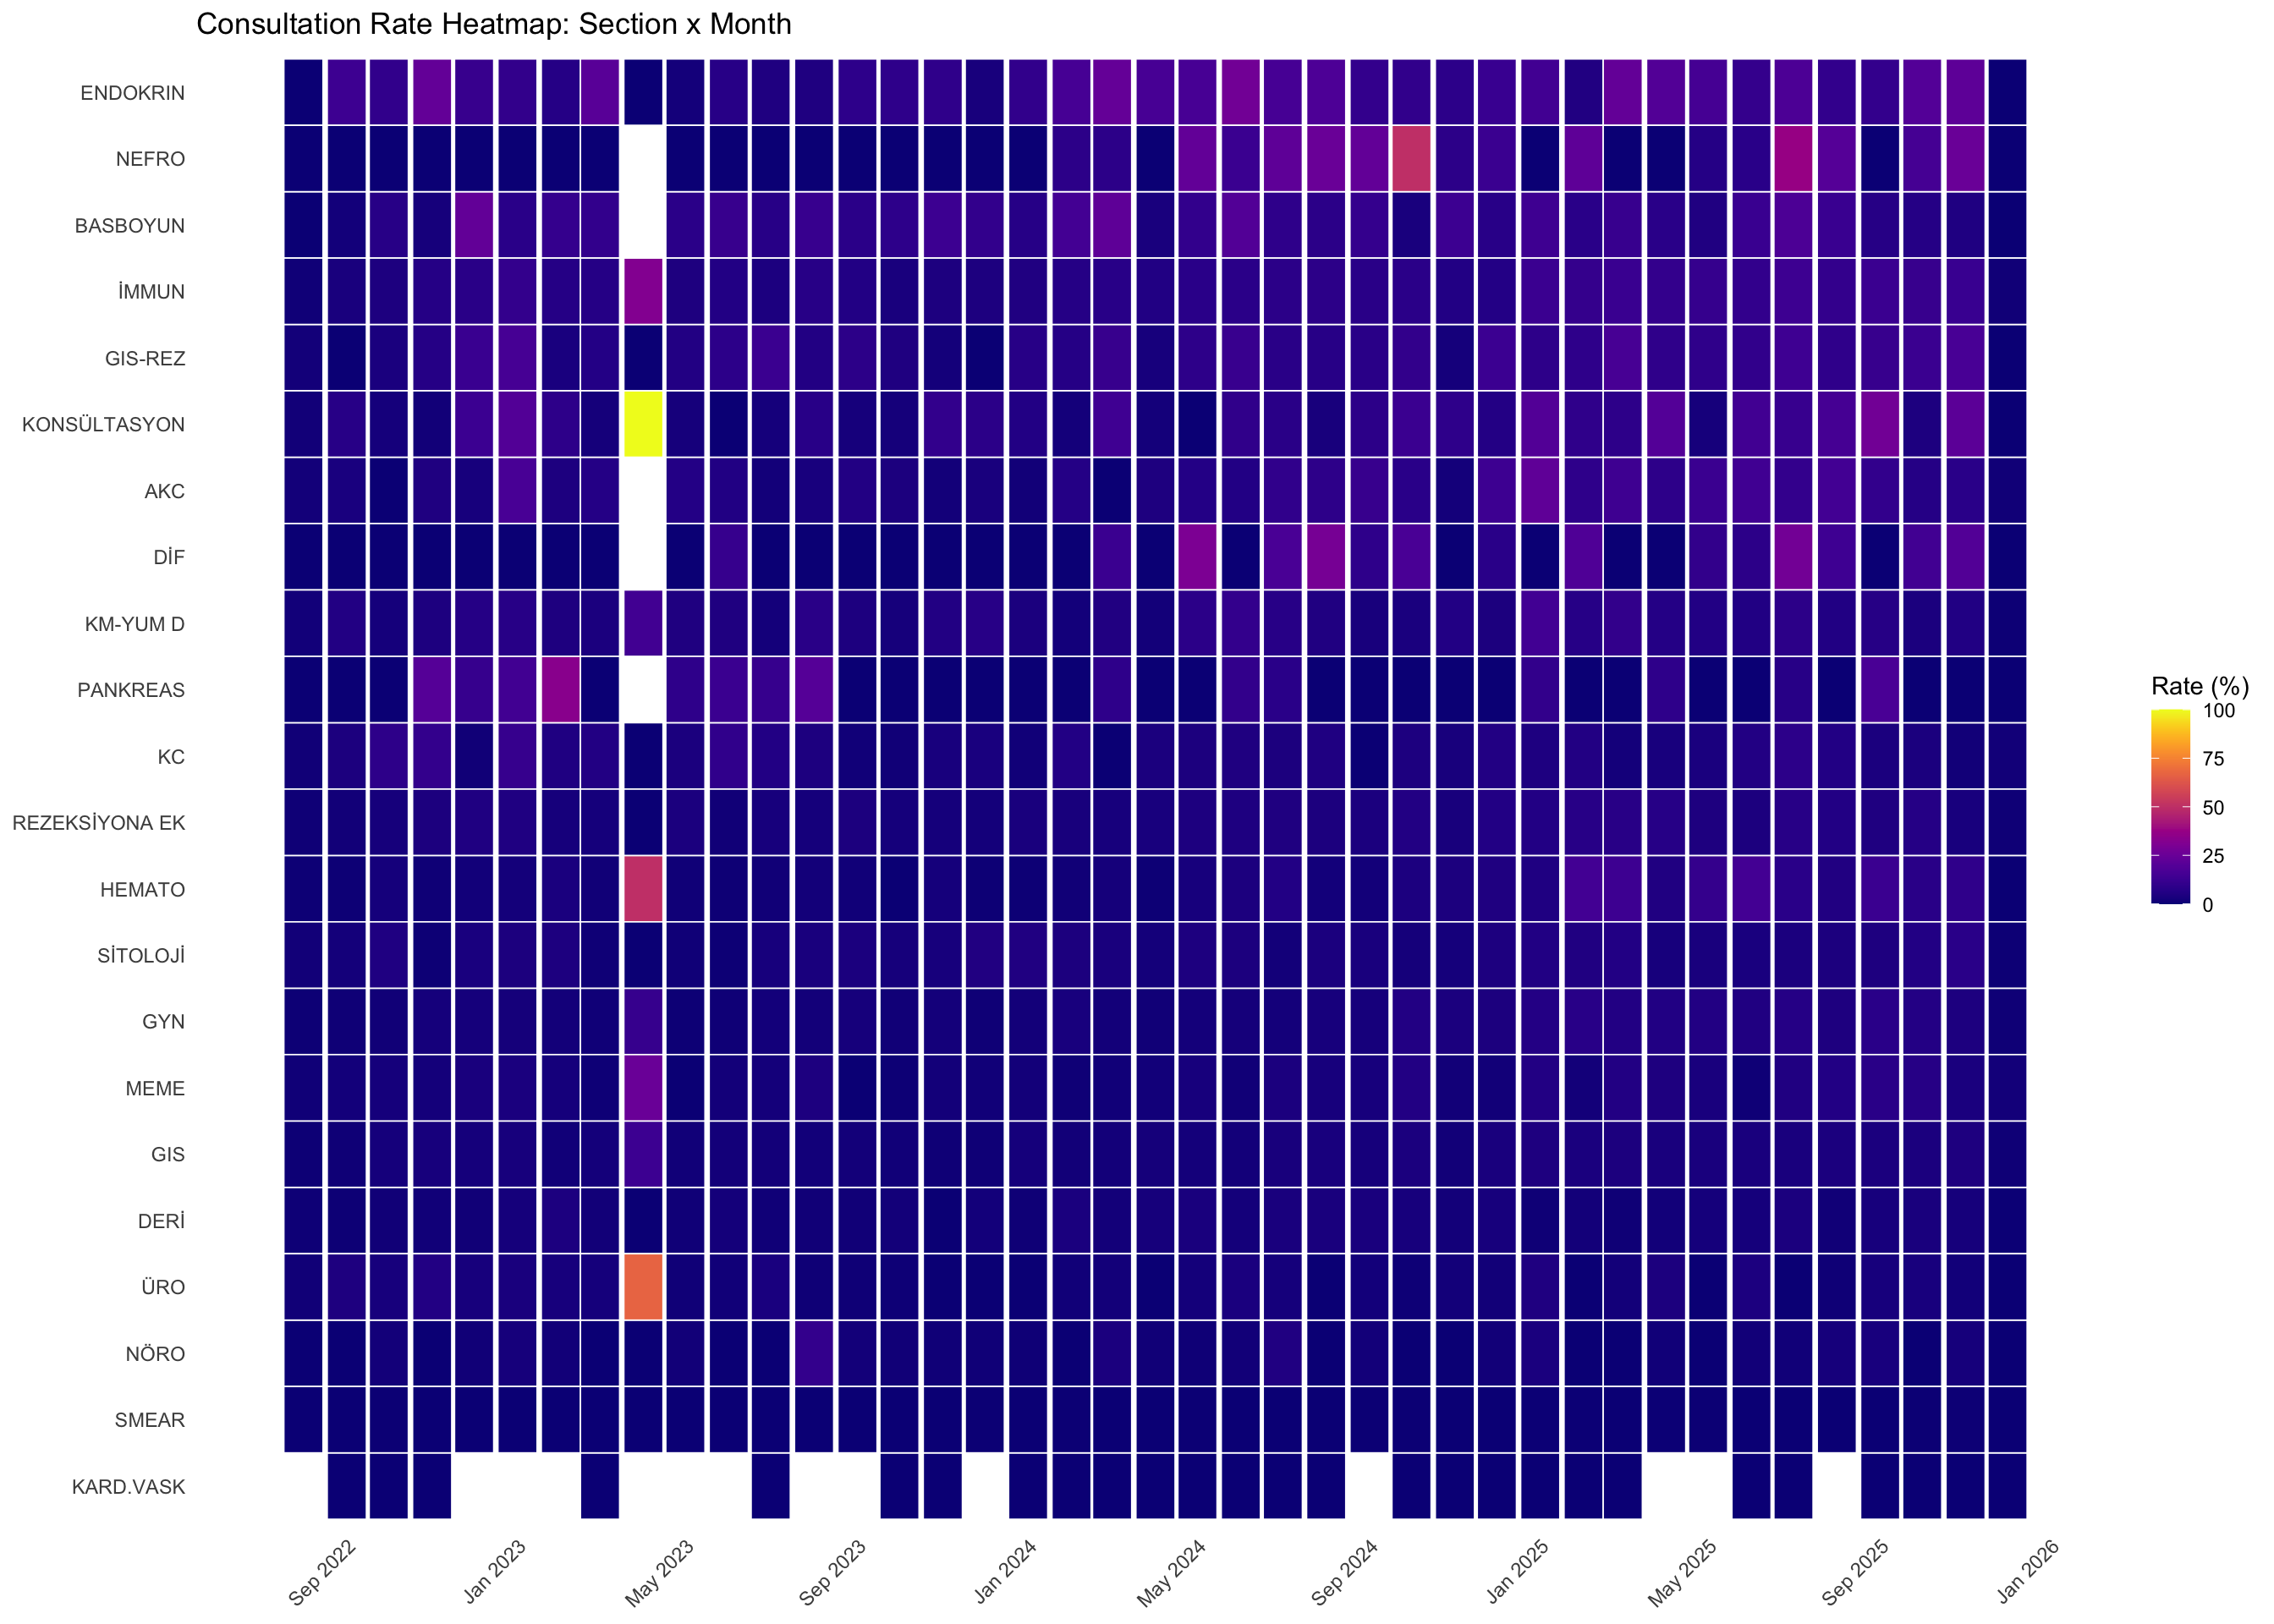
15.7.2 Section x Month Heatmap
15.7.3 Yearly Section Summary
| Section | 2022 | 2023 | 2024 | 2025 | Total_Cases |
|---|---|---|---|---|---|
| SMEAR | 0.04 | 0.02 | 0.06 | 0.13 | 116,620 |
| GIS | 1.74 | 1.52 | 2.31 | 3.38 | 86,997 |
| İMMUN | 4.42 | 5.75 | 7.04 | 10.35 | 46,025 |
| GYN | 1.50 | 1.46 | 2.62 | 5.38 | 29,129 |
| REZEKSİYONA EK | 2.88 | 2.76 | 3.93 | 5.07 | 23,476 |
| DERİ | 0.95 | 1.49 | 2.51 | 1.87 | 18,266 |
| SİTOLOJİ | 2.47 | 2.82 | 3.38 | 4.27 | 11,573 |
| HEMATO | 1.08 | 1.52 | 2.56 | 8.76 | 9,764 |
| KM-YUM D | 3.92 | 4.98 | 4.99 | 6.40 | 9,421 |
| MEME | 2.02 | 1.59 | 2.12 | 4.22 | 9,085 |
| ÜRO | 3.38 | 1.63 | 1.31 | 1.85 | 8,048 |
| NÖRO | 0.53 | 1.87 | 1.29 | 1.35 | 4,124 |
| KC | 5.03 | 4.62 | 3.37 | 4.03 | 4,094 |
| BASBOYUN | 6.39 | 9.72 | 10.80 | 8.63 | 3,692 |
| AKC | 2.48 | 5.47 | 6.29 | 10.63 | 3,351 |
| GIS-REZ | 4.71 | 6.38 | 7.98 | 10.20 | 2,828 |
| ENDOKRIN | 11.31 | 8.00 | 14.96 | 13.01 | 2,542 |
| KONSÜLTASYON | 4.44 | 5.82 | 6.68 | 12.81 | 2,460 |
| DİF | 0.00 | 0.89 | 7.75 | 8.16 | 562 |
| NEFRO | 0.00 | 0.00 | 14.39 | 9.43 | 508 |
| PANKREAS | 4.65 | 6.00 | 2.50 | 3.96 | 480 |
| KARD.VASK | 0.00 | 0.00 | 0.00 | 0.00 | 106 |
15.8 Statistical Analysis of Section-Level Consultation Rates
[1] TRUE15.8.1 Do Consultation Rates Differ Across Sections?
A chi-square test of independence was performed to determine whether consultation rates vary significantly across biopsy sections. To satisfy independence, inferential tests are restricted to cases with a single non-auxiliary section assignment.
Inference subset: 250,357 single-section cases across 18 sections (excluded 65,112 multi-section cases).χ²(17) = 2195.2, p < 2.2e-16, Cramér's V = 0.094 (95% CI: 0.089–0.097)
Consultation rates differ **highly significantly** across biopsy sections. The effect size (Cramér's V) indicates a **small-to-medium** association.15.8.2 Which Sections Deviate from the Department Average?
Each section was compared against a leave-one-out department reference rate (computed from all other sections) using exact binomial tests with Benjamini-Hochberg correction.
| Section | Total Cases | Rate (%) | Direction | Odds Ratio | Reference Rate (%) | p (raw) | p (adj.) | Significant |
|---|---|---|---|---|---|---|---|---|
| SMEAR | 116,591 | 0.05 | Lower | 0.04 | 1.10 | 0.0000000 | 8.89e-323 | Yes |
| GIS | 68,090 | 1.02 | Higher | 2.25 | 0.46 | 0.0000000 | 5.47e-78 | Yes |
| BASBOYUN | 2,607 | 4.49 | Higher | 8.21 | 0.57 | 0.0000000 | 8.55e-63 | Yes |
| İMMUN | 988 | 4.96 | Higher | 8.76 | 0.59 | 0.0000000 | 3.72e-28 | Yes |
| KM-YUM D | 6,227 | 1.61 | Higher | 2.78 | 0.58 | 0.0000000 | 8.31e-18 | Yes |
| ENDOKRIN | 507 | 4.54 | Higher | 7.85 | 0.60 | 0.0000000 | 5.91e-13 | Yes |
| GYN | 21,762 | 0.98 | Higher | 1.71 | 0.57 | 0.0000000 | 1.80e-12 | Yes |
| SİTOLOJİ | 5,486 | 1.44 | Higher | 2.46 | 0.59 | 0.0000000 | 7.06e-12 | Yes |
| REZEKSİYONA EK | 436 | 3.21 | Higher | 5.45 | 0.61 | 0.0000007 | 1.36e-06 | Yes |
| AKC | 421 | 1.90 | Higher | 3.17 | 0.61 | 0.0046967 | 0.0071 | Yes |
| GIS-REZ | 514 | 1.75 | Higher | 2.92 | 0.61 | 0.0047425 | 0.0071 | Yes |
| NÖRO | 414 | 1.93 | Higher | 3.22 | 0.61 | 0.0042549 | 0.0071 | Yes |
| KONSÜLTASYON | 163 | 2.45 | Higher | 4.11 | 0.61 | 0.0181108 | 0.0251 | Yes |
| HEMATO | 4,712 | 0.38 | Lower | 0.62 | 0.61 | 0.0397096 | 0.0511 | No |
| MEME | 3,234 | 0.46 | Lower | 0.76 | 0.61 | 0.3647431 | 0.4377 | No |
| DERİ | 14,215 | 0.65 | Higher | 1.07 | 0.61 | 0.5171258 | 0.5818 | No |
| ÜRO | 3,393 | 0.68 | Higher | 1.11 | 0.61 | 0.5798803 | 0.614 | No |
| KC | 418 | 0.72 | Higher | 1.18 | 0.61 | 0.7454676 | 0.7455 | No |
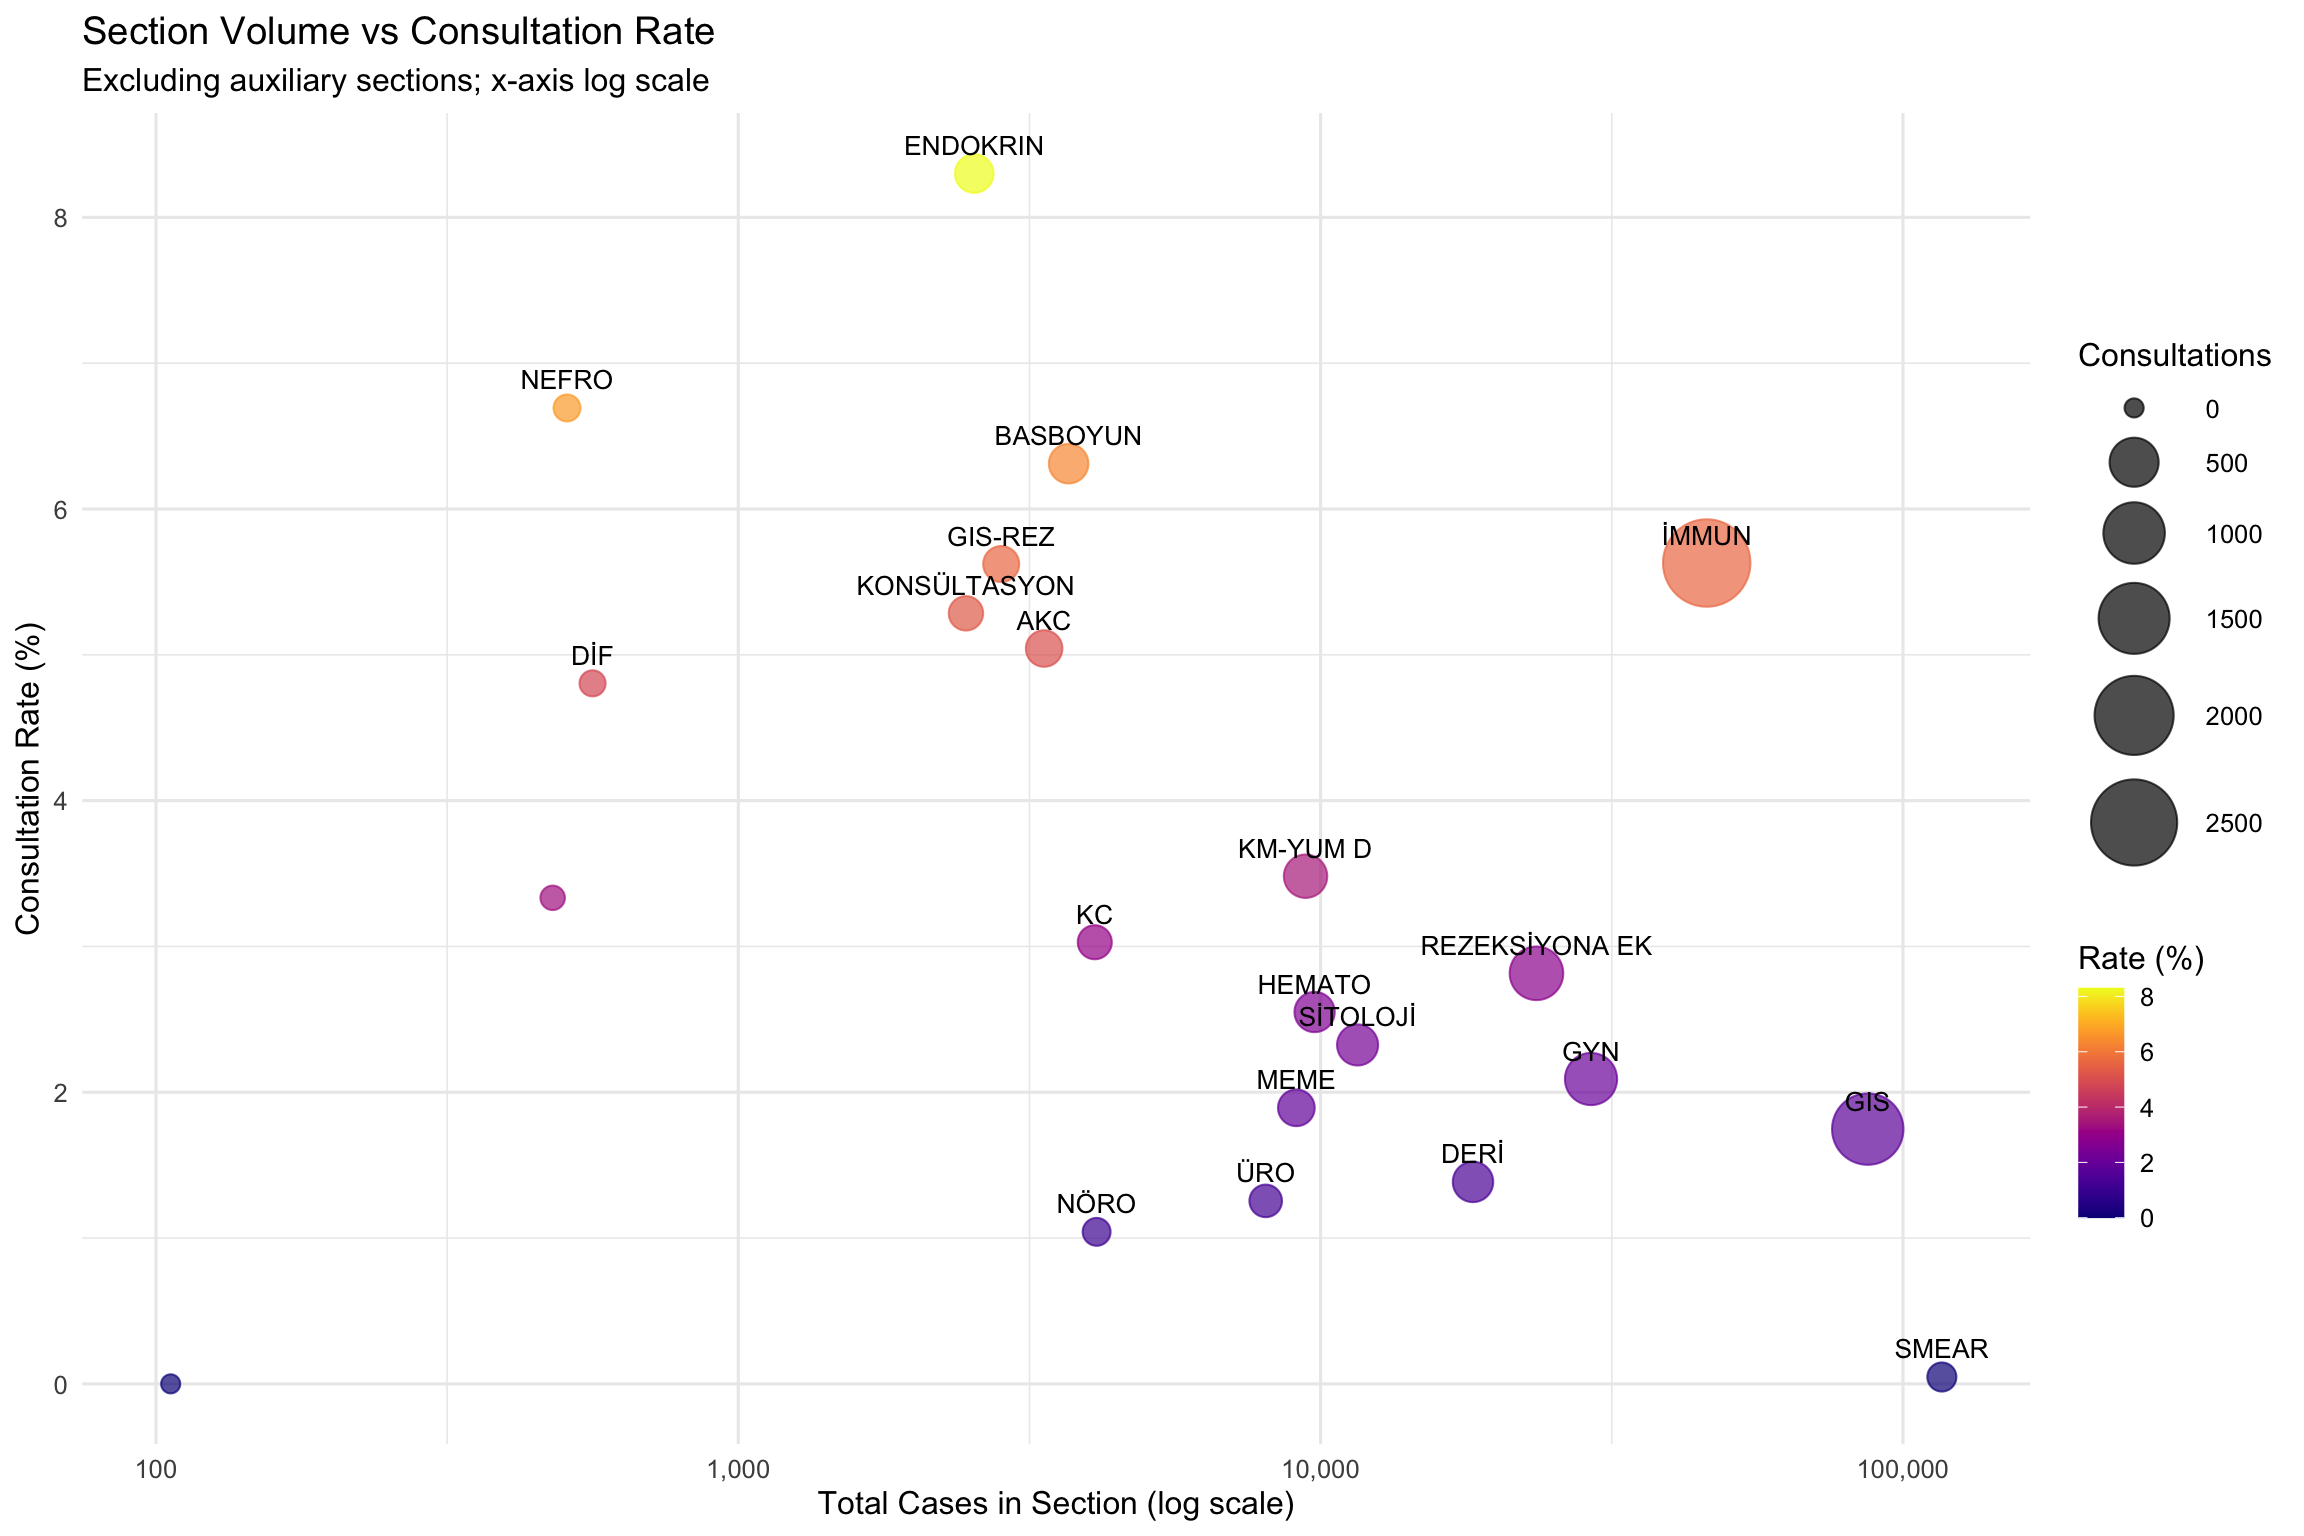
15.8.3 Correlation: Section Volume and Consultation Rate
Spearman's ρ = -0.587, S = 1538, p = 0.0104
There is a significant negative correlation between section case volume and consultation rate. Sections with higher caseloads tend to have lower consultation rates.15.8.4 Temporal Trend in Department-Wide Consultation Rate
TFPW Mann-Kendall (monthly deseasonalized): τ = 0.533, p = 0.0000, lag-1 rho = 0.333

There is a statistically significant increasing trend in the department-wide monthly consultation rate over time.
15.8.5 Seasonal Pattern in Consultation Rates
Kruskal-Wallis test: H(11) = 3.42, p = 0.9839, ε² = 0.000
No significant seasonal pattern was detected in monthly consultation rates. The consultation rate appears stable across calendar months.15.9 Section → Responder Expertise
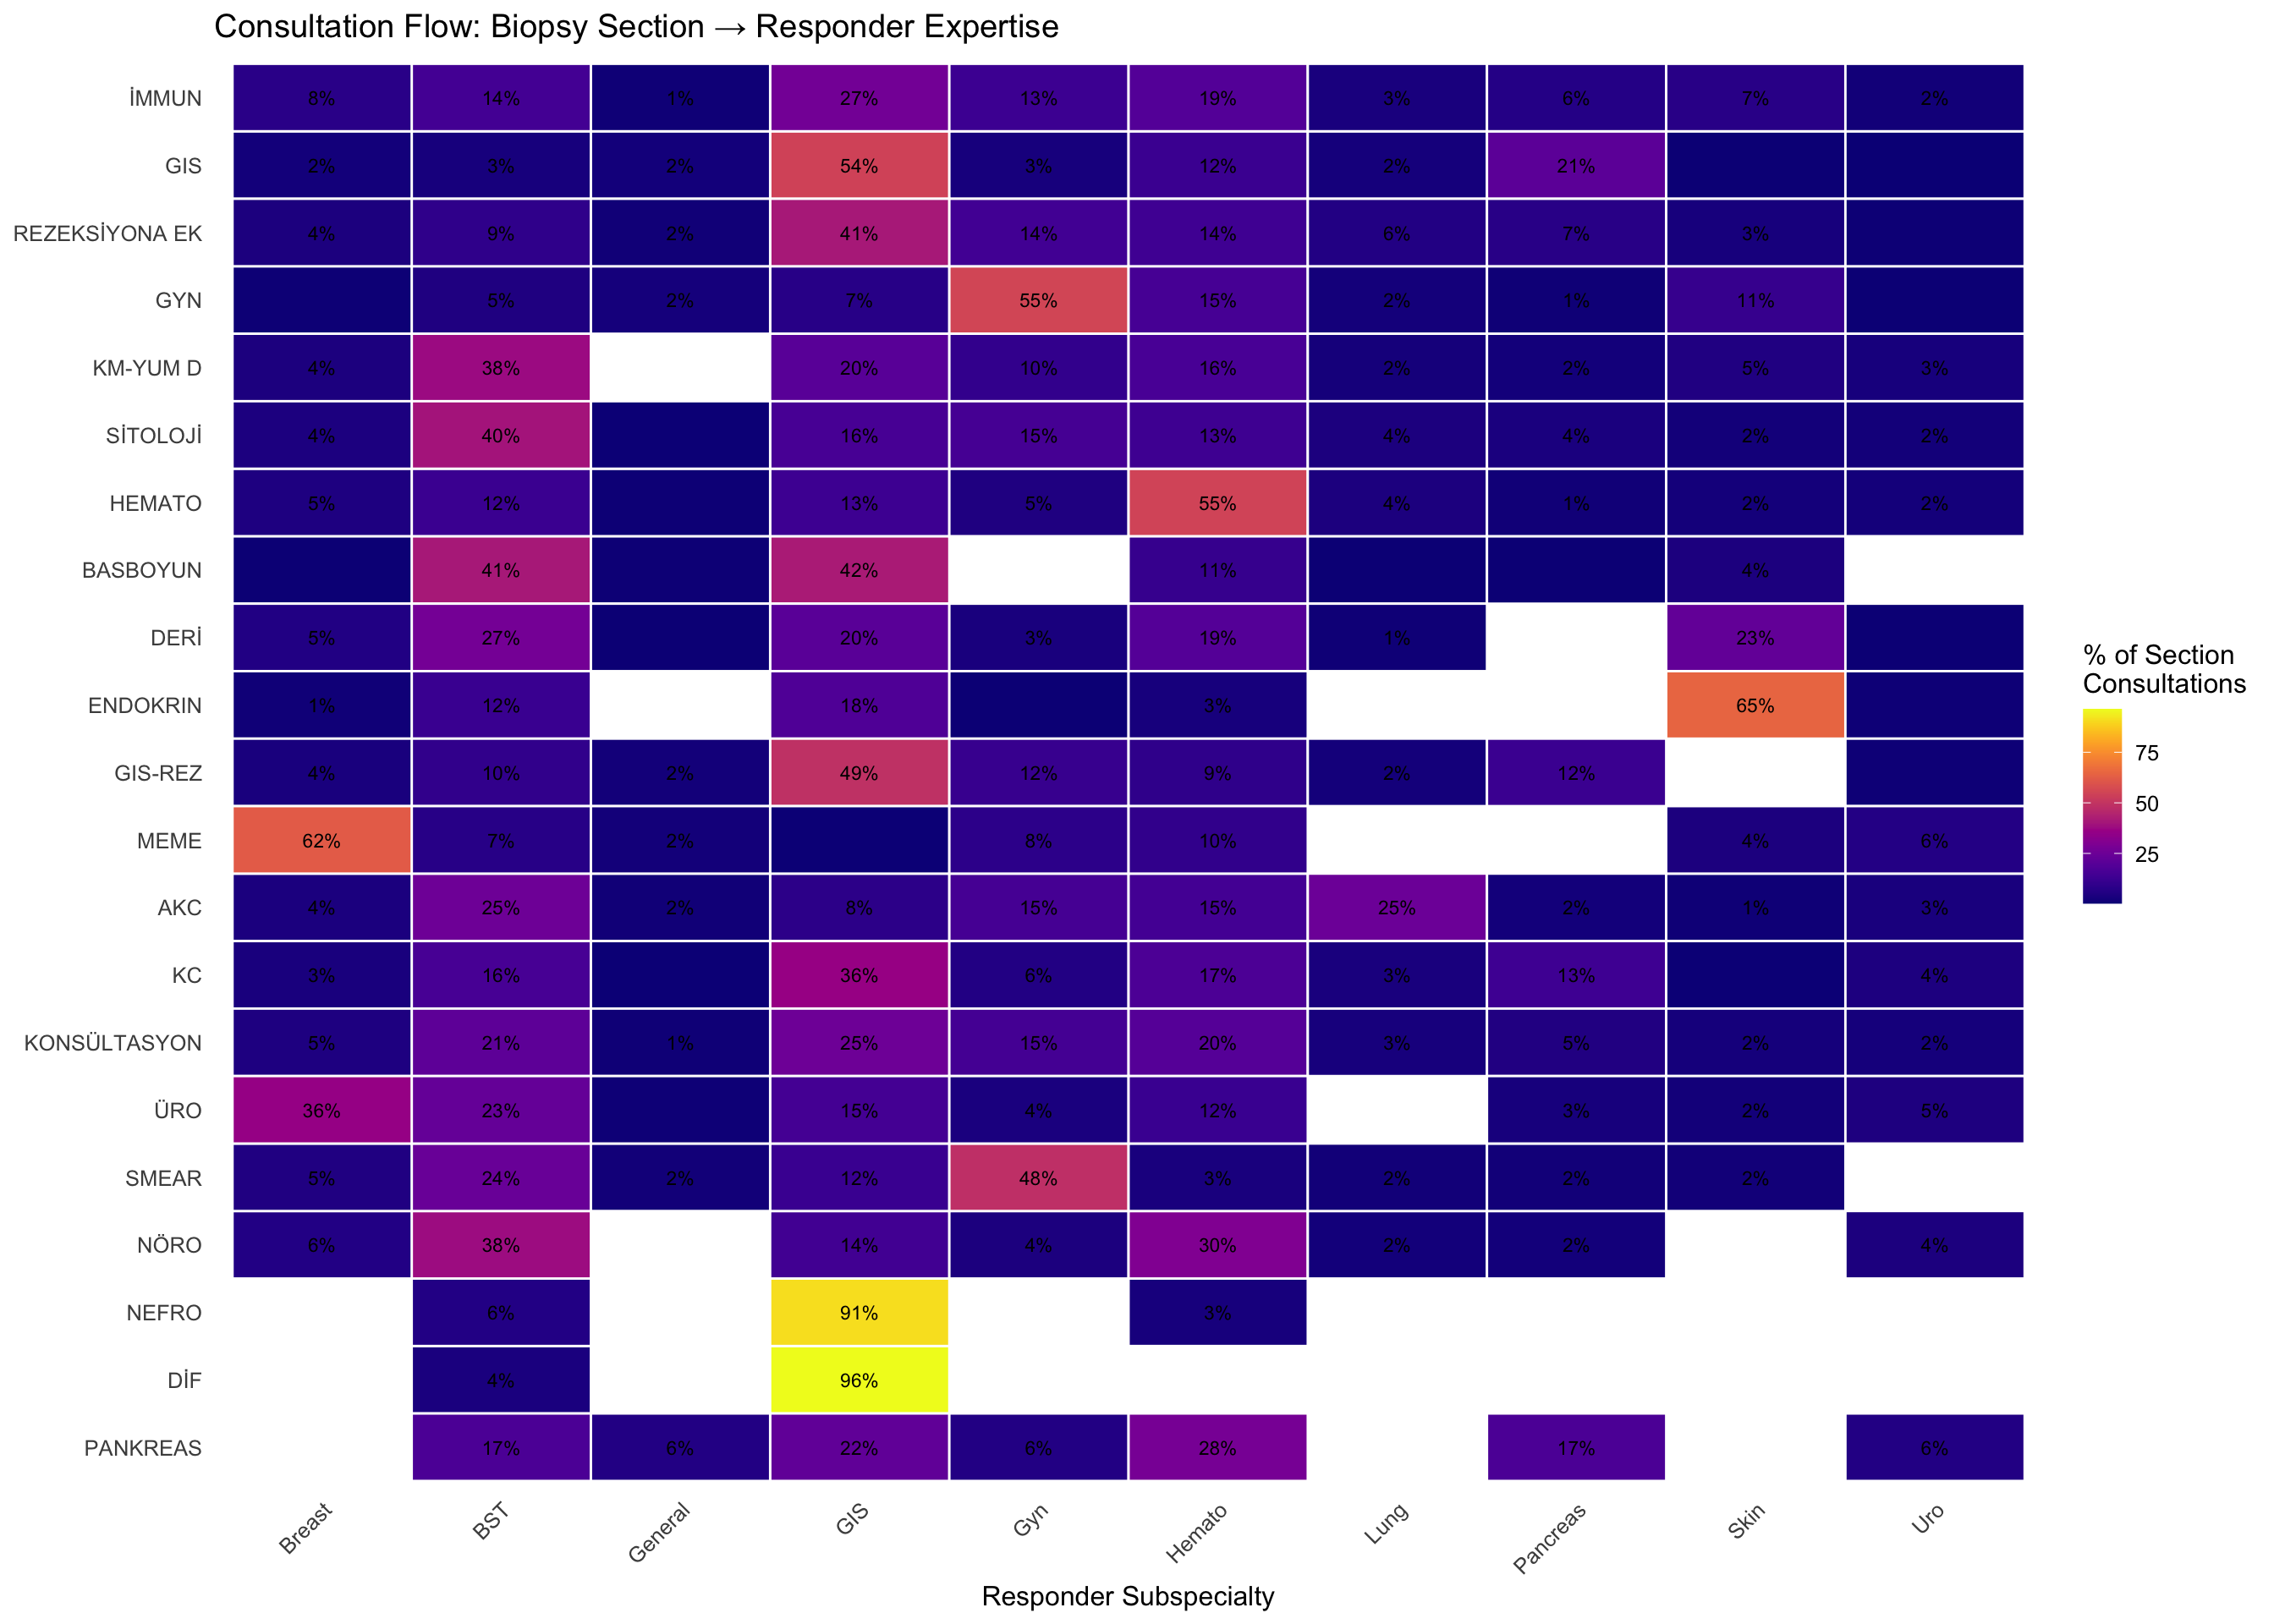
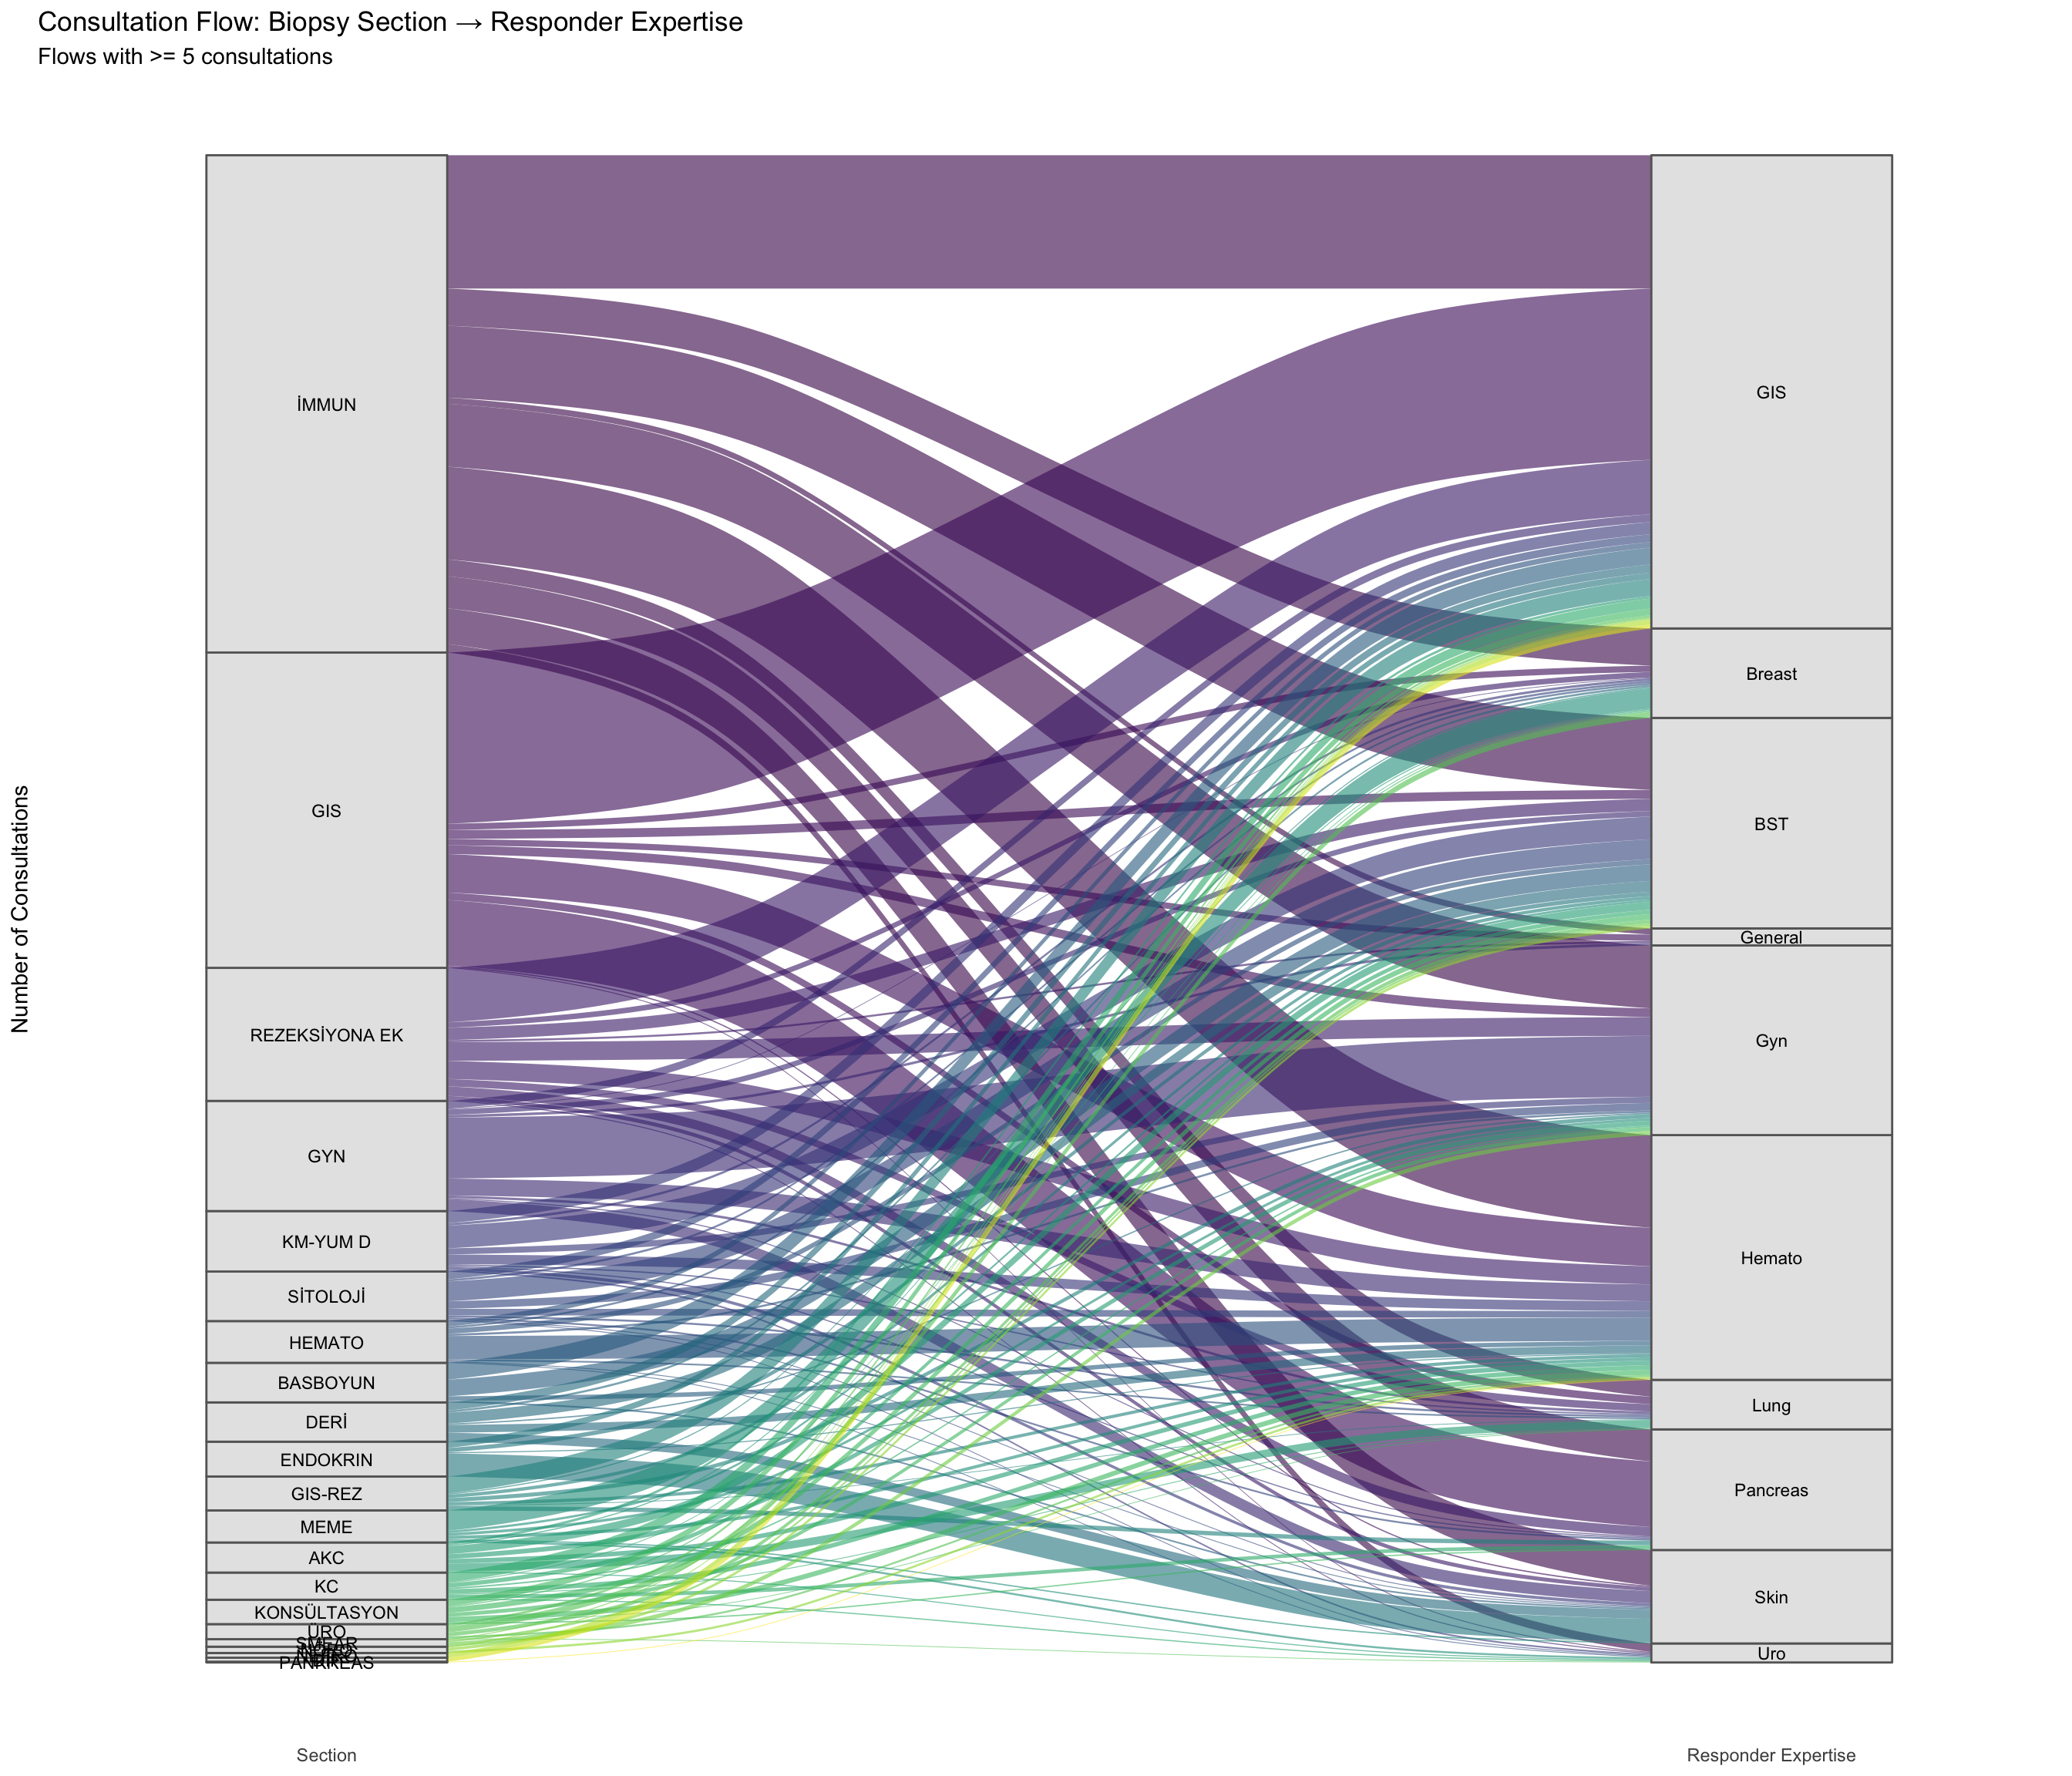
Which biopsy sections generate consultations directed to which subspecialty groups? For example, do GIS section cases predominantly get referred to GI pathologists, or do they also flow to hematopathologists and other experts?
[1] TRUE| Section | BST | Breast | GIS | General | Gyn | Hemato | Lung | Pancreas | Skin | Uro | Total |
|---|---|---|---|---|---|---|---|---|---|---|---|
| İMMUN | 14.5 | 7.5 | 26.8 | 1.2 | 12.7 | 18.6 | 3.4 | 6.4 | 7.2 | 1.7 | 3,241 |
| GIS | 2.8 | 2.0 | 54.3 | 2.0 | 2.8 | 12.2 | 2.4 | 20.8 | 0.4 | 0.3 | 2,055 |
| REZEKSİYONA EK | 9.2 | 4.2 | 40.9 | 1.5 | 14.1 | 13.6 | 5.5 | 7.2 | 3.0 | 0.8 | 867 |
| GYN | 5.0 | 0.7 | 7.1 | 2.4 | 55.1 | 15.3 | 2.2 | 1.0 | 11.0 | 0.4 | 721 |
| KM-YUM D | 37.6 | 4.1 | 20.1 | 0.0 | 10.2 | 16.0 | 2.3 | 2.0 | 5.1 | 2.8 | 394 |
| SİTOLOJİ | 39.7 | 4.3 | 15.7 | 0.6 | 15.1 | 13.2 | 4.0 | 3.7 | 1.8 | 1.8 | 325 |
| HEMATO | 12.2 | 4.7 | 12.9 | 0.7 | 5.0 | 54.7 | 4.0 | 1.4 | 2.2 | 2.2 | 278 |
| BASBOYUN | 41.1 | 0.4 | 41.8 | 0.8 | 0.0 | 11.0 | 0.4 | 0.4 | 4.2 | 0.0 | 263 |
| DERİ | 27.2 | 5.4 | 20.3 | 0.4 | 3.4 | 19.2 | 1.1 | 0.0 | 22.6 | 0.4 | 261 |
| ENDOKRIN | 12.0 | 1.3 | 17.6 | 0.0 | 0.4 | 3.0 | 0.0 | 0.0 | 64.8 | 0.9 | 233 |
| GIS-REZ | 9.7 | 3.5 | 48.9 | 1.8 | 11.5 | 9.3 | 2.2 | 12.3 | 0.0 | 0.9 | 227 |
| MEME | 7.0 | 62.1 | 0.5 | 1.9 | 8.4 | 9.8 | 0.0 | 0.0 | 4.2 | 6.1 | 214 |
| AKC | 25.4 | 3.9 | 8.3 | 1.5 | 15.1 | 14.6 | 24.9 | 2.0 | 1.0 | 3.4 | 205 |
| KC | 15.6 | 3.4 | 36.3 | 0.6 | 5.6 | 16.8 | 3.4 | 13.4 | 0.6 | 4.5 | 179 |
| KONSÜLTASYON | 21.3 | 4.7 | 25.4 | 1.2 | 14.8 | 19.5 | 3.0 | 5.3 | 2.4 | 2.4 | 169 |
| ÜRO | 23.1 | 36.1 | 14.8 | 0.9 | 3.7 | 12.0 | 0.0 | 2.8 | 1.9 | 4.6 | 108 |
| SMEAR | 24.1 | 5.2 | 12.1 | 1.7 | 48.3 | 3.4 | 1.7 | 1.7 | 1.7 | 0.0 | 58 |
| NÖRO | 38.0 | 6.0 | 14.0 | 0.0 | 4.0 | 30.0 | 2.0 | 2.0 | 0.0 | 4.0 | 50 |
| NEFRO | 5.9 | 0.0 | 91.2 | 0.0 | 0.0 | 2.9 | 0.0 | 0.0 | 0.0 | 0.0 | 34 |
| DİF | 3.7 | 0.0 | 96.3 | 0.0 | 0.0 | 0.0 | 0.0 | 0.0 | 0.0 | 0.0 | 27 |
| PANKREAS | 16.7 | 0.0 | 22.2 | 5.6 | 5.6 | 27.8 | 0.0 | 16.7 | 0.0 | 5.6 | 18 |
| GENETIK | 0.0 | 0.0 | 33.3 | 0.0 | 33.3 | 0.0 | 0.0 | 33.3 | 0.0 | 0.0 | 3 |
15.10 Section → Consultation Topic
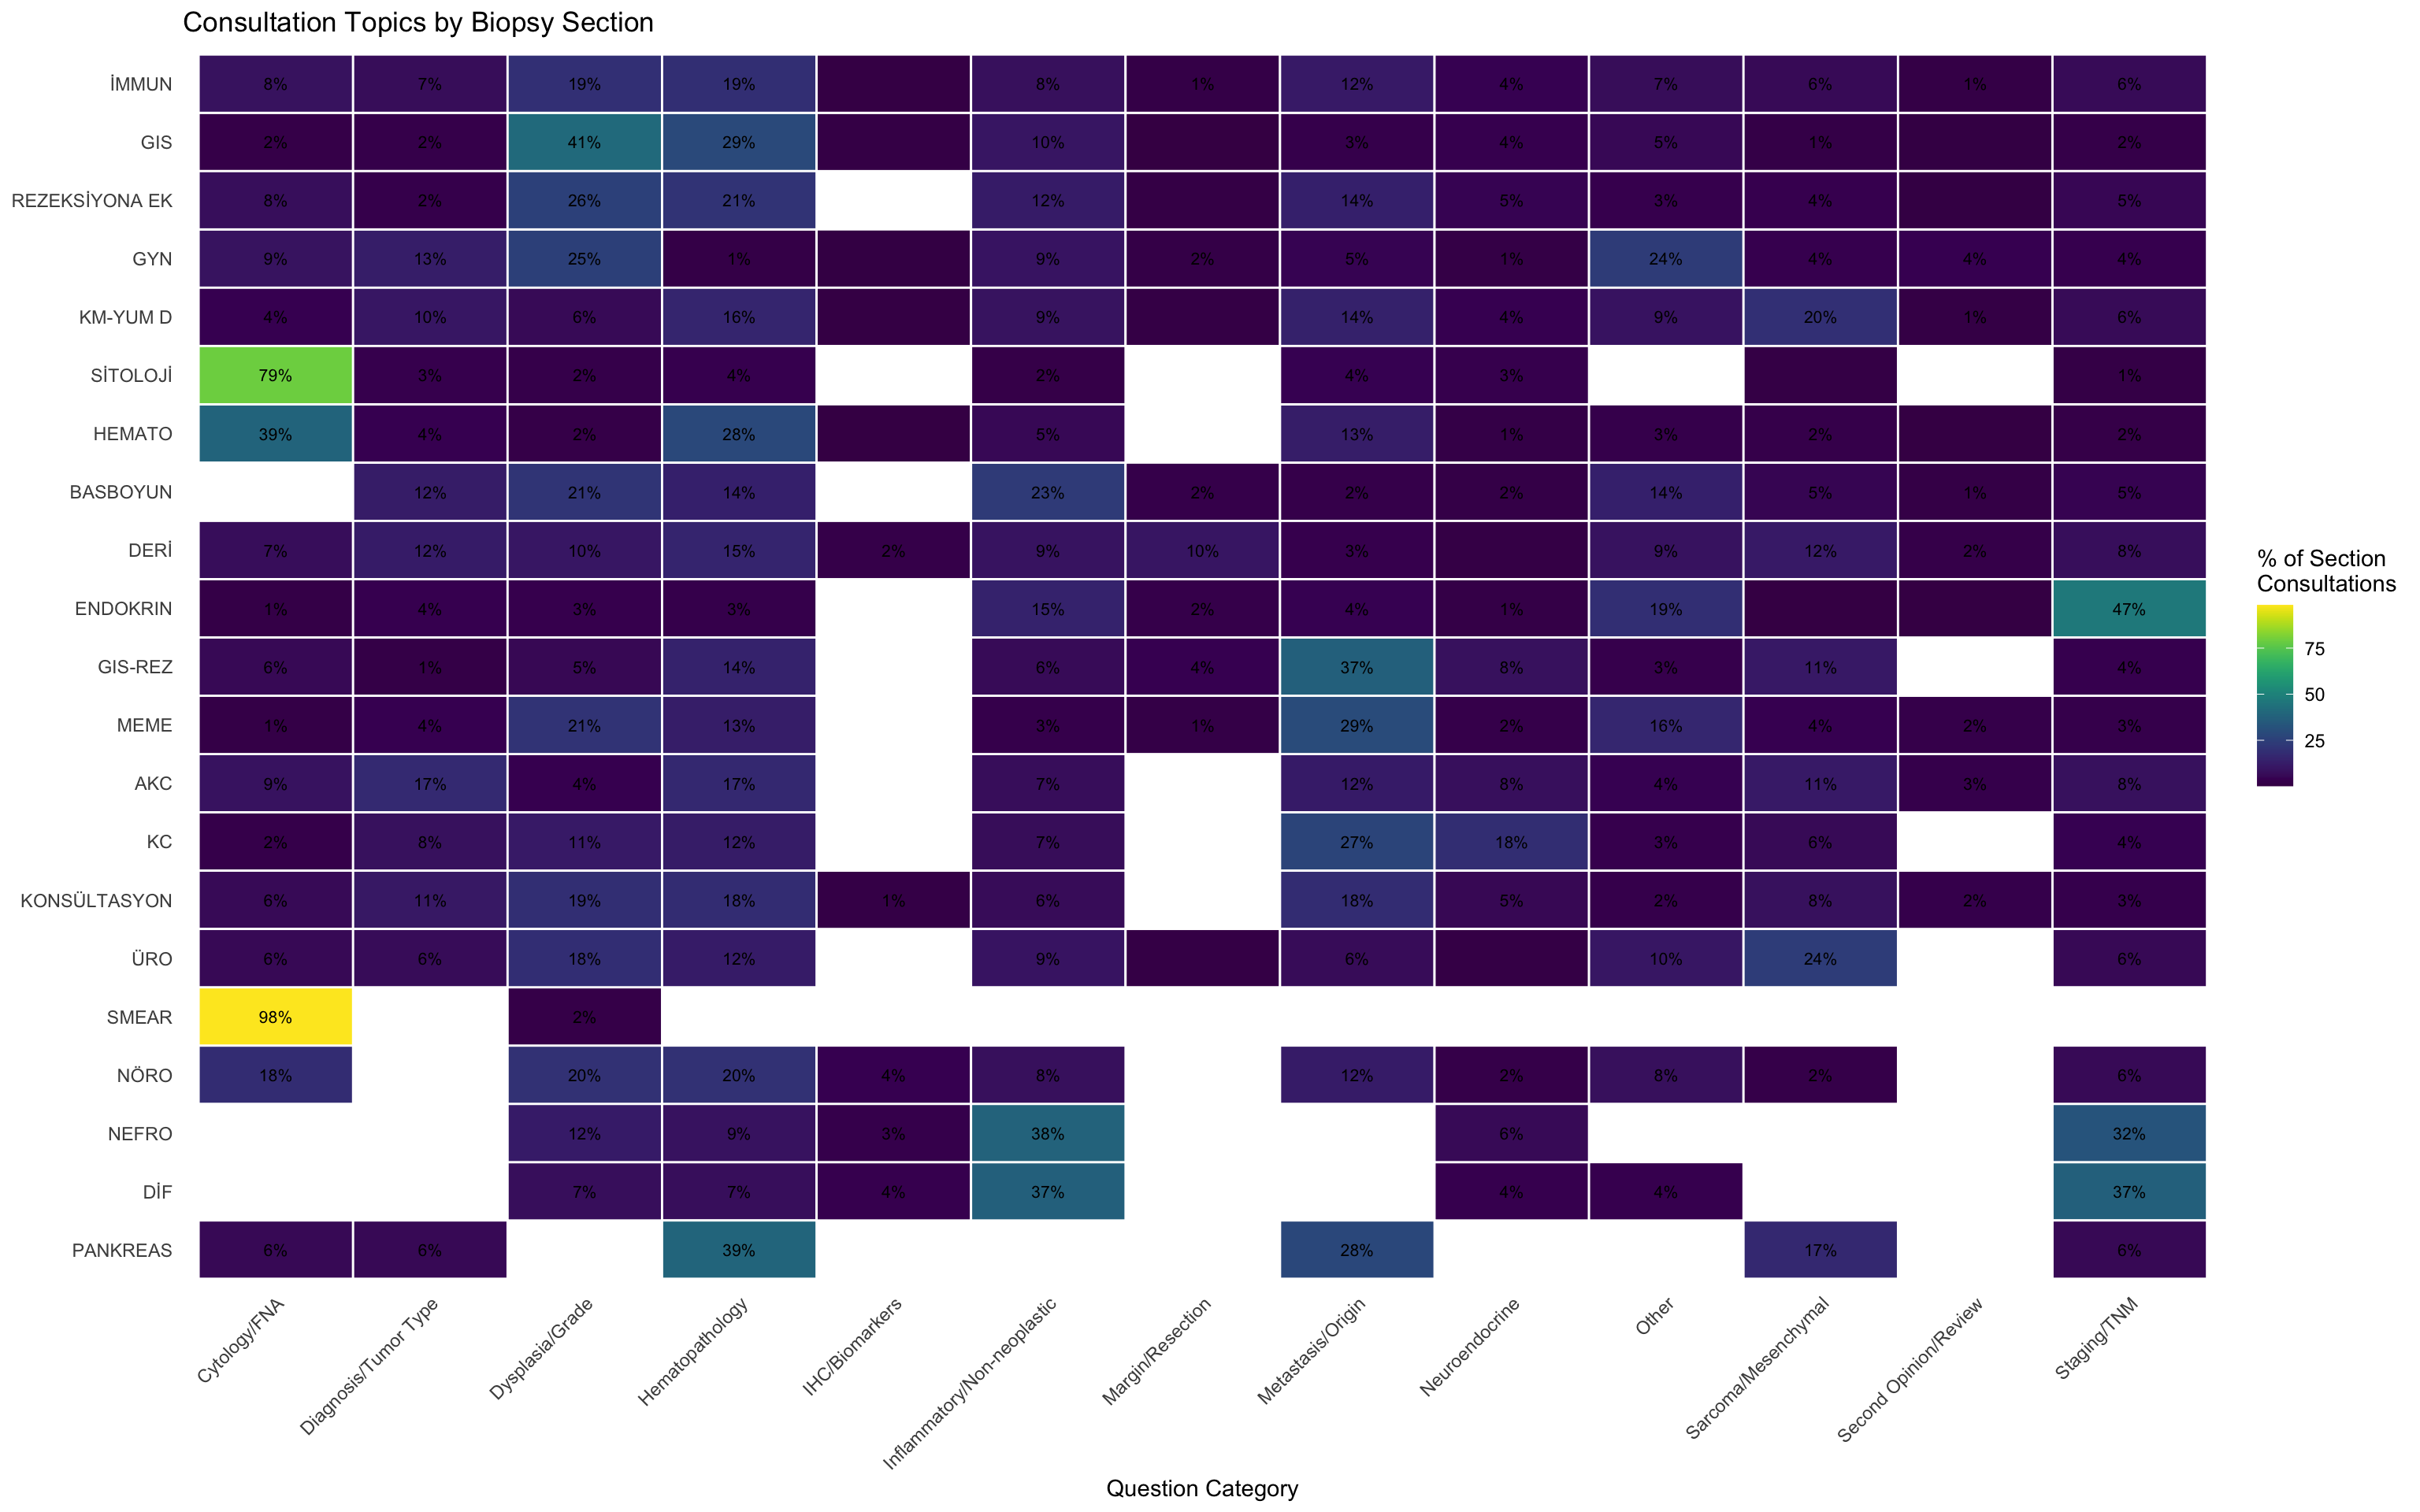
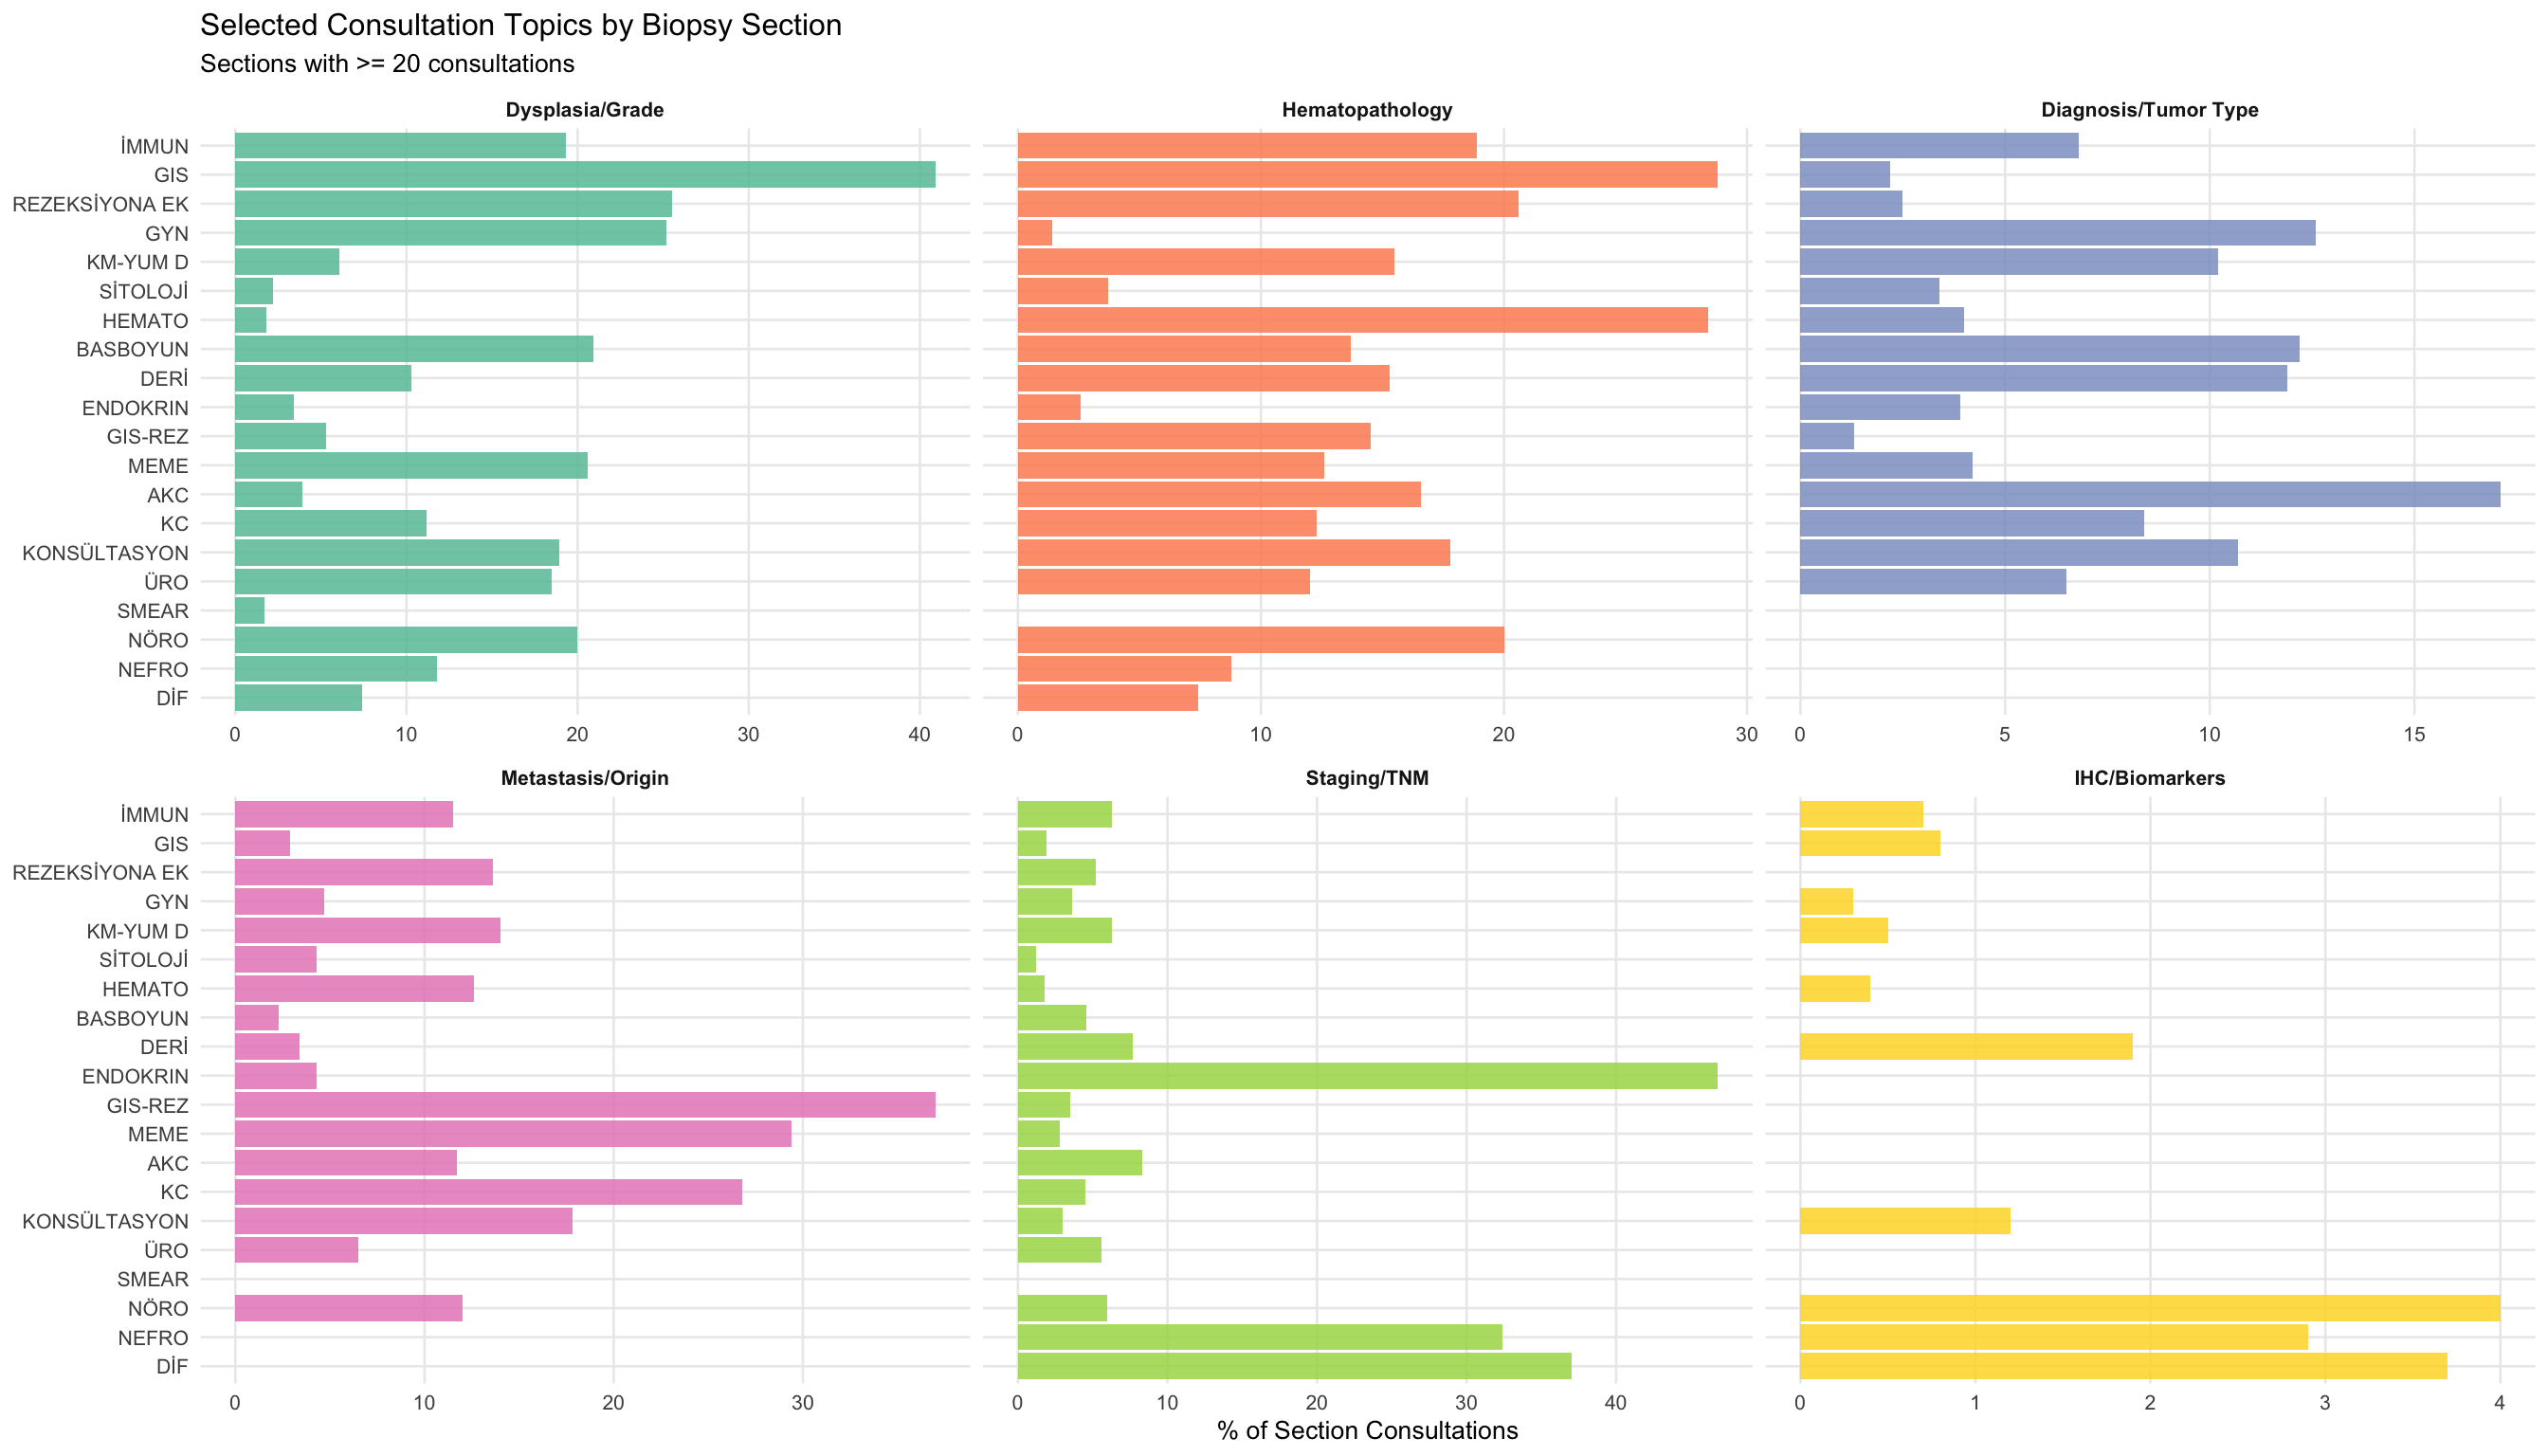
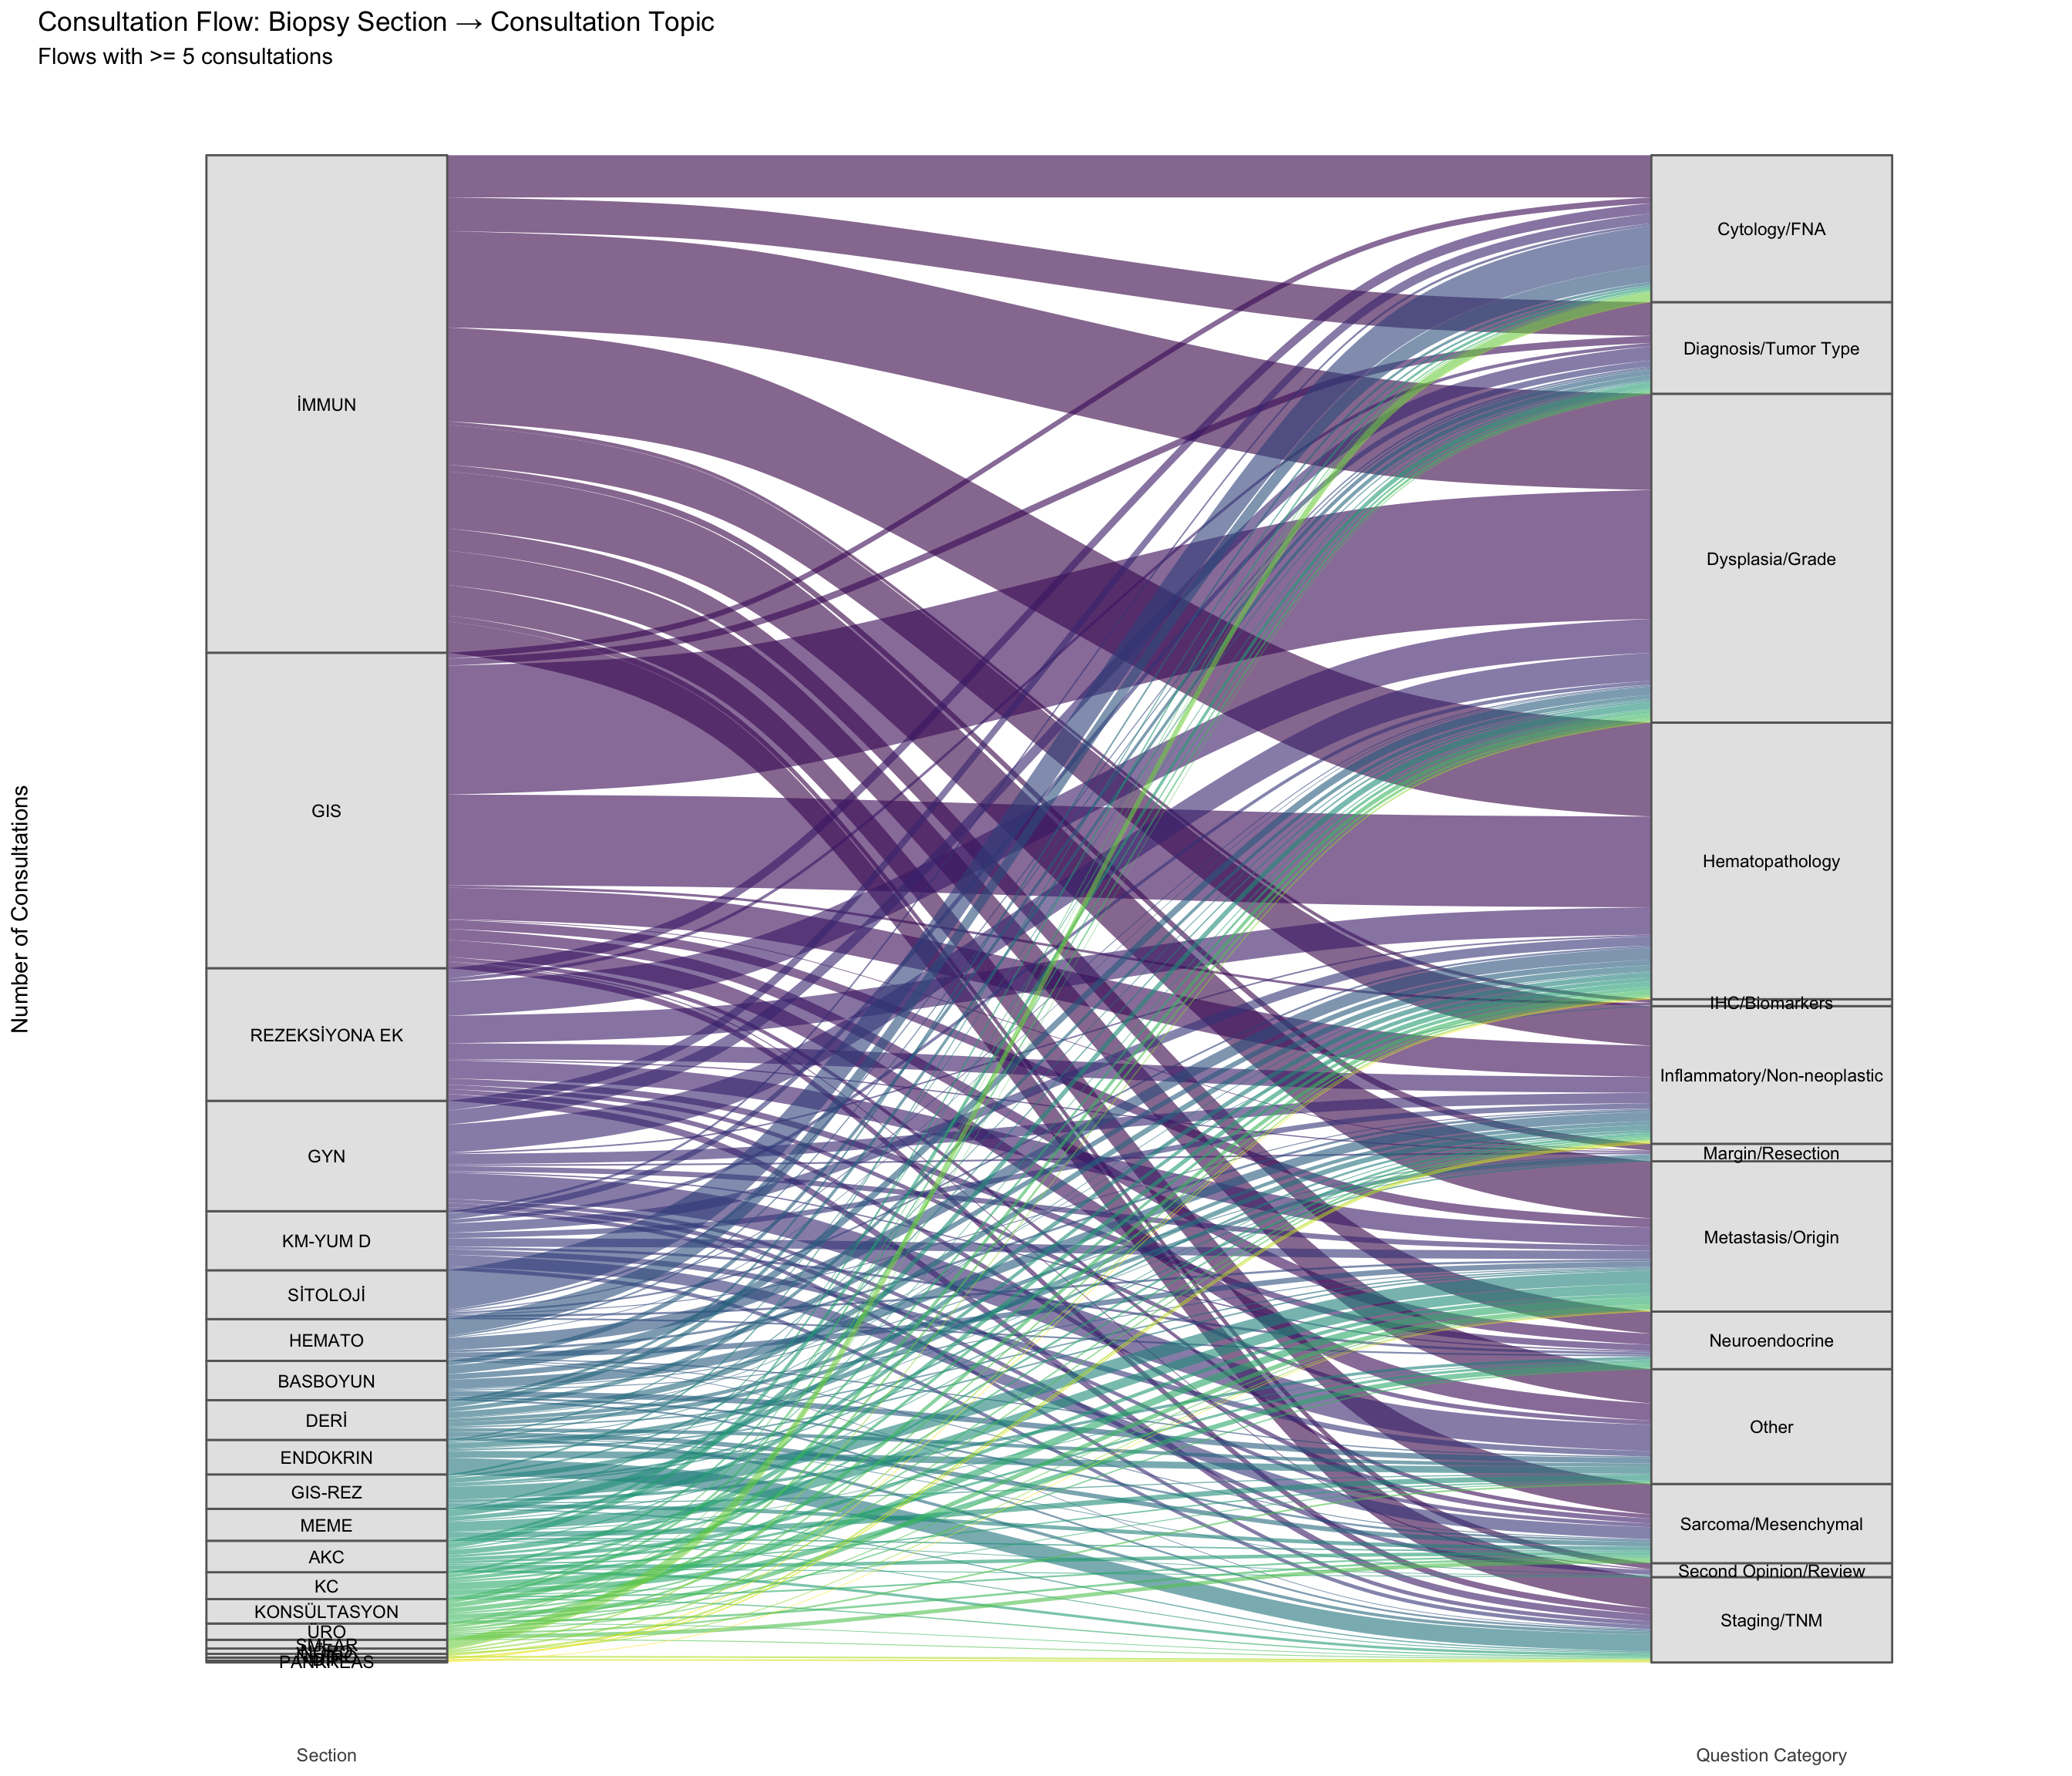
What types of questions arise from each biopsy section? This reveals section-specific consultation patterns — for instance, whether GYN cases generate more dysplasia questions than GIS cases, or whether hematopathology queries dominate certain sections.
| Section | Cytology/FNA | Diagnosis/Tumor Type | Dysplasia/Grade | Hematopathology | Inflammatory/Non-neoplastic | Metastasis/Origin | Neuroendocrine | Other | Sarcoma/Mesenchymal | Second Opinion/Review | Staging/TNM | Margin/Resection | IHC/Biomarkers | Total |
|---|---|---|---|---|---|---|---|---|---|---|---|---|---|---|
| İMMUN | 8.5 | 6.8 | 19.3 | 18.9 | 8.0 | 11.5 | 4.4 | 6.9 | 6.1 | 1.2 | 6.3 | 1.4 | 0.7 | 3,241 |
| GIS | 1.8 | 2.2 | 40.9 | 28.8 | 9.9 | 2.9 | 3.5 | 5.4 | 1.3 | 0.3 | 1.9 | 0.2 | 0.8 | 2,055 |
| REZEKSİYONA EK | 7.7 | 2.5 | 25.5 | 20.6 | 11.9 | 13.6 | 4.7 | 3.2 | 3.7 | 0.3 | 5.2 | 0.9 | 0.0 | 867 |
| GYN | 8.9 | 12.6 | 25.2 | 1.4 | 9.3 | 4.7 | 1.2 | 23.7 | 3.5 | 4.0 | 3.6 | 1.5 | 0.3 | 721 |
| KM-YUM D | 4.1 | 10.2 | 6.1 | 15.5 | 8.9 | 14.0 | 4.1 | 9.1 | 19.5 | 1.0 | 6.3 | 0.8 | 0.5 | 394 |
| SİTOLOJİ | 79.1 | 3.4 | 2.2 | 3.7 | 1.8 | 4.3 | 3.4 | 0.0 | 0.9 | 0.0 | 1.2 | 0.0 | 0.0 | 325 |
| HEMATO | 38.8 | 4.0 | 1.8 | 28.4 | 5.4 | 12.6 | 1.4 | 2.9 | 2.2 | 0.4 | 1.8 | 0.0 | 0.4 | 278 |
| BASBOYUN | 0.0 | 12.2 | 20.9 | 13.7 | 22.8 | 2.3 | 1.5 | 13.7 | 4.9 | 1.1 | 4.6 | 2.3 | 0.0 | 263 |
| DERİ | 7.3 | 11.9 | 10.3 | 15.3 | 9.2 | 3.4 | 0.8 | 8.8 | 11.5 | 1.9 | 7.7 | 10.0 | 1.9 | 261 |
| ENDOKRIN | 1.3 | 3.9 | 3.4 | 2.6 | 14.6 | 4.3 | 1.3 | 18.9 | 0.4 | 0.4 | 46.8 | 2.1 | 0.0 | 233 |
| GIS-REZ | 5.7 | 1.3 | 5.3 | 14.5 | 6.2 | 37.0 | 8.4 | 3.1 | 11.0 | 0.0 | 3.5 | 4.0 | 0.0 | 227 |
| MEME | 1.4 | 4.2 | 20.6 | 12.6 | 2.8 | 29.4 | 2.3 | 15.9 | 4.2 | 2.3 | 2.8 | 1.4 | 0.0 | 214 |
| AKC | 8.8 | 17.1 | 3.9 | 16.6 | 7.3 | 11.7 | 7.8 | 4.4 | 11.2 | 2.9 | 8.3 | 0.0 | 0.0 | 205 |
| KC | 2.2 | 8.4 | 11.2 | 12.3 | 6.7 | 26.8 | 18.4 | 3.4 | 6.1 | 0.0 | 4.5 | 0.0 | 0.0 | 179 |
| KONSÜLTASYON | 5.9 | 10.7 | 18.9 | 17.8 | 6.5 | 17.8 | 5.3 | 2.4 | 8.3 | 2.4 | 3.0 | 0.0 | 1.2 | 169 |
| ÜRO | 5.6 | 6.5 | 18.5 | 12.0 | 9.3 | 6.5 | 0.9 | 10.2 | 24.1 | 0.0 | 5.6 | 0.9 | 0.0 | 108 |
| SMEAR | 98.3 | 0.0 | 1.7 | 0.0 | 0.0 | 0.0 | 0.0 | 0.0 | 0.0 | 0.0 | 0.0 | 0.0 | 0.0 | 58 |
| NÖRO | 18.0 | 0.0 | 20.0 | 20.0 | 8.0 | 12.0 | 2.0 | 8.0 | 2.0 | 0.0 | 6.0 | 0.0 | 4.0 | 50 |
| NEFRO | 0.0 | 0.0 | 11.8 | 8.8 | 38.2 | 0.0 | 5.9 | 0.0 | 0.0 | 0.0 | 32.4 | 0.0 | 2.9 | 34 |
| DİF | 0.0 | 0.0 | 7.4 | 7.4 | 37.0 | 0.0 | 3.7 | 3.7 | 0.0 | 0.0 | 37.0 | 0.0 | 3.7 | 27 |
| PANKREAS | 5.6 | 5.6 | 0.0 | 38.9 | 0.0 | 27.8 | 0.0 | 0.0 | 16.7 | 0.0 | 5.6 | 0.0 | 0.0 | 18 |
| GENETIK | 0.0 | 0.0 | 0.0 | 0.0 | 0.0 | 100.0 | 0.0 | 0.0 | 0.0 | 0.0 | 0.0 | 0.0 | 0.0 | 3 |
15.10.1 Comparing Dysplasia and Hematopathology Questions Across Sections
15.11 The “Low Threshold” Hypothesis
NoteWhat is the “Low Threshold” Hypothesis?
In traditional (glass slide) pathology, requesting a colleague’s opinion requires physically carrying slides to another workstation. This effort acts as a friction filter – pathologists may rely on their own judgment for borderline cases rather than walk down the hall. In a fully digital environment, consultation is as easy as clicking a button. The “Low Threshold” hypothesis predicts that removing this friction increases consultation volume (more consultations happen) while decreasing intensity per consultation (each one is resolved faster, because many of the additional consultations are quick, low-complexity “micro-consults” that would not have occurred in the analog world).
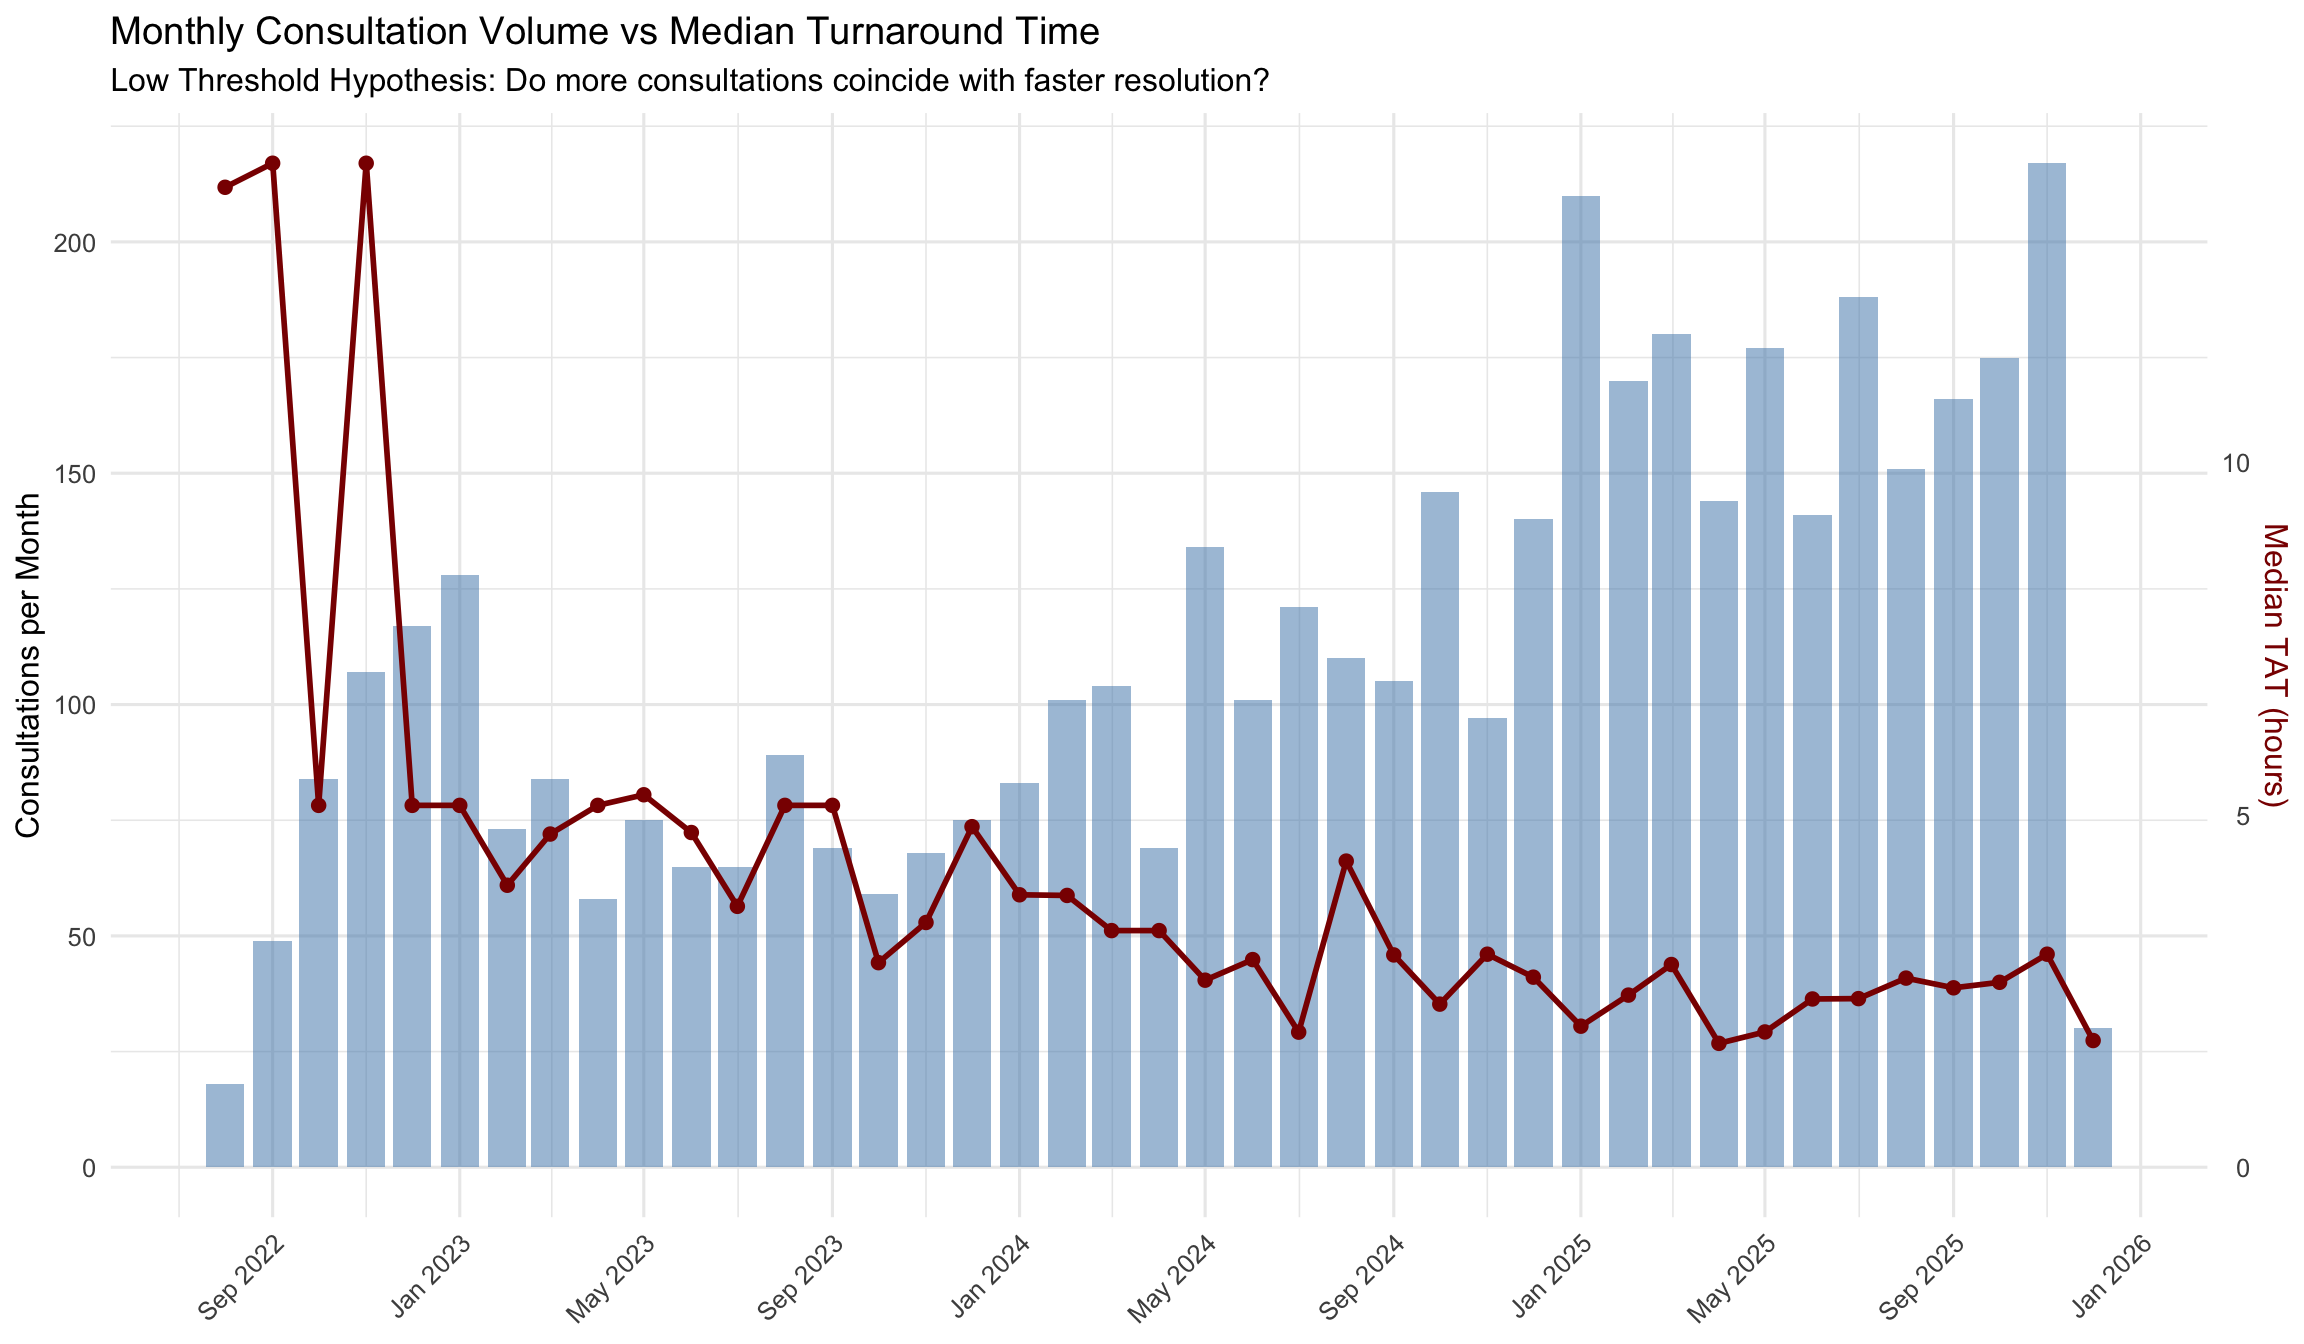
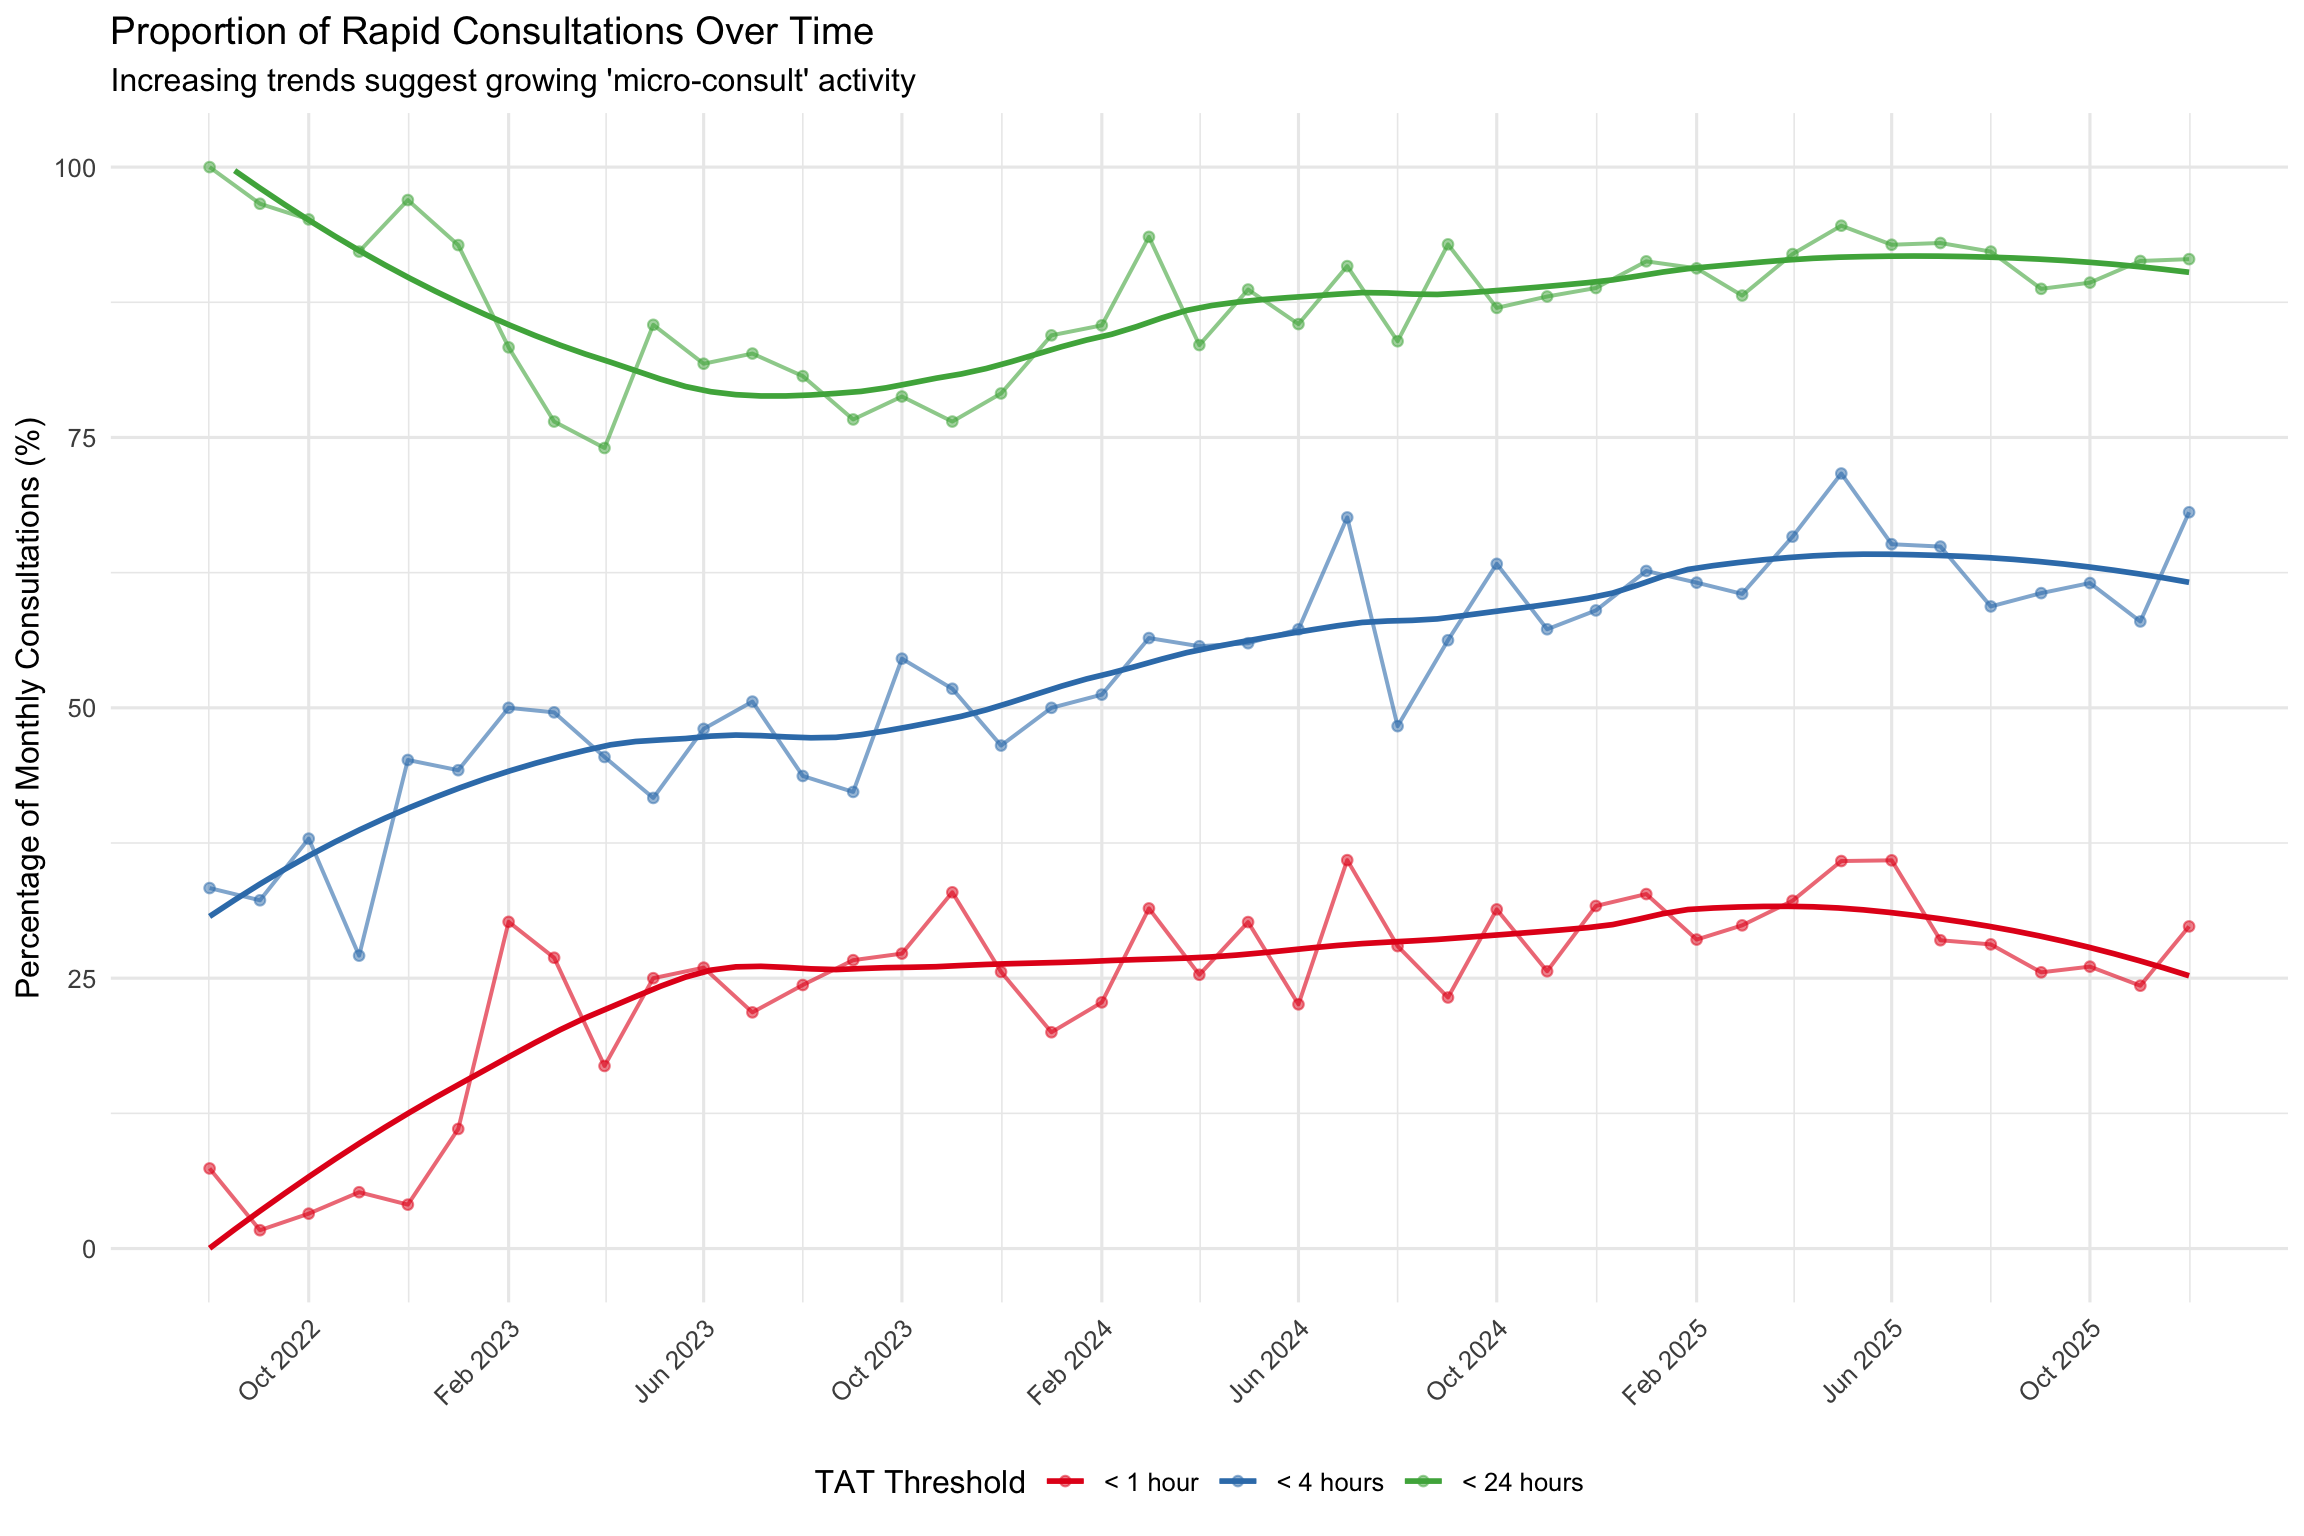
If the data supports this hypothesis, we would expect to see: (1) a negative correlation between monthly consultation volume and median turnaround time, (2) an increasing proportion of rapid consultations over time, and (3) formal trend tests confirming rising volume and falling TAT.
[1] TRUE15.11.1 Monthly Volume and Intensity Trends
We aggregate consultation records by month to examine how volume and turnaround time (TAT) co-evolve over the study period.
| Month | Consultations | Median TAT (h) | Mean TAT (h) | % < 1h | % < 4h | % < 24h |
|---|---|---|---|---|---|---|
| 2022-08 | 18 | 13.9 | 11.2 | 7.4 | 33.3 | 100.0 |
| 2022-09 | 49 | 14.2 | 13.0 | 1.7 | 32.2 | 96.6 |
| 2022-10 | 84 | 5.1 | 9.5 | 3.2 | 37.9 | 95.2 |
| 2022-11 | 107 | 14.2 | 13.0 | 5.2 | 27.1 | 92.2 |
| 2022-12 | 117 | 5.1 | 8.5 | 4.1 | 45.2 | 97.0 |
| 2023-01 | 128 | 5.1 | 10.3 | 11.1 | 44.2 | 92.8 |
| 2023-02 | 73 | 4.0 | 13.8 | 30.2 | 50.0 | 83.3 |
| 2023-03 | 84 | 4.7 | 16.4 | 26.9 | 49.6 | 76.5 |
| 2023-04 | 58 | 5.1 | 17.0 | 16.9 | 45.5 | 74.0 |
| 2023-05 | 75 | 5.3 | 14.4 | 25.0 | 41.7 | 85.4 |
| 2023-06 | 65 | 4.7 | 15.8 | 26.0 | 48.1 | 81.8 |
| 2023-07 | 65 | 3.7 | 12.8 | 21.8 | 50.6 | 82.8 |
| 2023-08 | 89 | 5.1 | 14.8 | 24.4 | 43.7 | 80.7 |
| 2023-09 | 69 | 5.1 | 16.4 | 26.7 | 42.2 | 76.7 |
| 2023-10 | 59 | 2.9 | 14.8 | 27.3 | 54.5 | 78.8 |
| 2023-11 | 68 | 3.5 | 17.1 | 32.9 | 51.8 | 76.5 |
| 2023-12 | 75 | 4.8 | 13.1 | 25.6 | 46.5 | 79.1 |
| 2024-01 | 83 | 3.9 | 11.2 | 20.0 | 50.0 | 84.4 |
| 2024-02 | 101 | 3.9 | 14.8 | 22.8 | 51.2 | 85.4 |
| 2024-03 | 104 | 3.4 | 8.2 | 31.5 | 56.5 | 93.5 |
| 2024-04 | 69 | 3.4 | 13.4 | 25.3 | 55.7 | 83.5 |
| 2024-05 | 134 | 2.7 | 9.5 | 30.2 | 56.0 | 88.7 |
| 2024-06 | 101 | 2.9 | 11.0 | 22.6 | 57.3 | 85.5 |
| 2024-07 | 121 | 1.9 | 8.1 | 35.9 | 67.6 | 90.8 |
| 2024-08 | 110 | 4.3 | 12.5 | 28.0 | 48.3 | 83.9 |
| 2024-09 | 105 | 3.0 | 9.7 | 23.2 | 56.2 | 92.9 |
| 2024-10 | 146 | 2.3 | 9.6 | 31.4 | 63.3 | 87.0 |
| 2024-11 | 97 | 3.0 | 10.2 | 25.6 | 57.3 | 88.0 |
| 2024-12 | 140 | 2.7 | 10.2 | 31.7 | 59.0 | 88.8 |
| 2025-01 | 210 | 2.0 | 8.1 | 32.8 | 62.7 | 91.3 |
| 2025-02 | 170 | 2.4 | 7.4 | 28.6 | 61.6 | 90.6 |
| 2025-03 | 180 | 2.9 | 9.9 | 29.9 | 60.5 | 88.1 |
| 2025-04 | 144 | 1.8 | 7.8 | 32.2 | 65.8 | 92.0 |
| 2025-05 | 177 | 1.9 | 6.0 | 35.8 | 71.7 | 94.6 |
| 2025-06 | 141 | 2.4 | 7.4 | 35.9 | 65.1 | 92.8 |
| 2025-07 | 188 | 2.4 | 8.4 | 28.5 | 64.9 | 93.0 |
| 2025-08 | 151 | 2.7 | 7.9 | 28.1 | 59.4 | 92.2 |
| 2025-09 | 166 | 2.5 | 10.0 | 25.5 | 60.6 | 88.7 |
| 2025-10 | 175 | 2.6 | 9.0 | 26.1 | 61.5 | 89.3 |
| 2025-11 | 217 | 3.0 | 8.4 | 24.3 | 58.0 | 91.3 |
| 2025-12 | 30 | 1.8 | 5.3 | 29.8 | 68.1 | 91.5 |
15.11.2 Volume vs Intensity: Dual-Axis Visualization
15.11.3 Correlation: Volume and Turnaround Time
Spearman's rho = -0.586, S = 18212, p = 0.0001 (n = 41 months)
A **significant negative correlation** was found between monthly consultation volume and median TAT. Months with more consultations tend to have shorter turnaround times — consistent with the Low Threshold Hypothesis.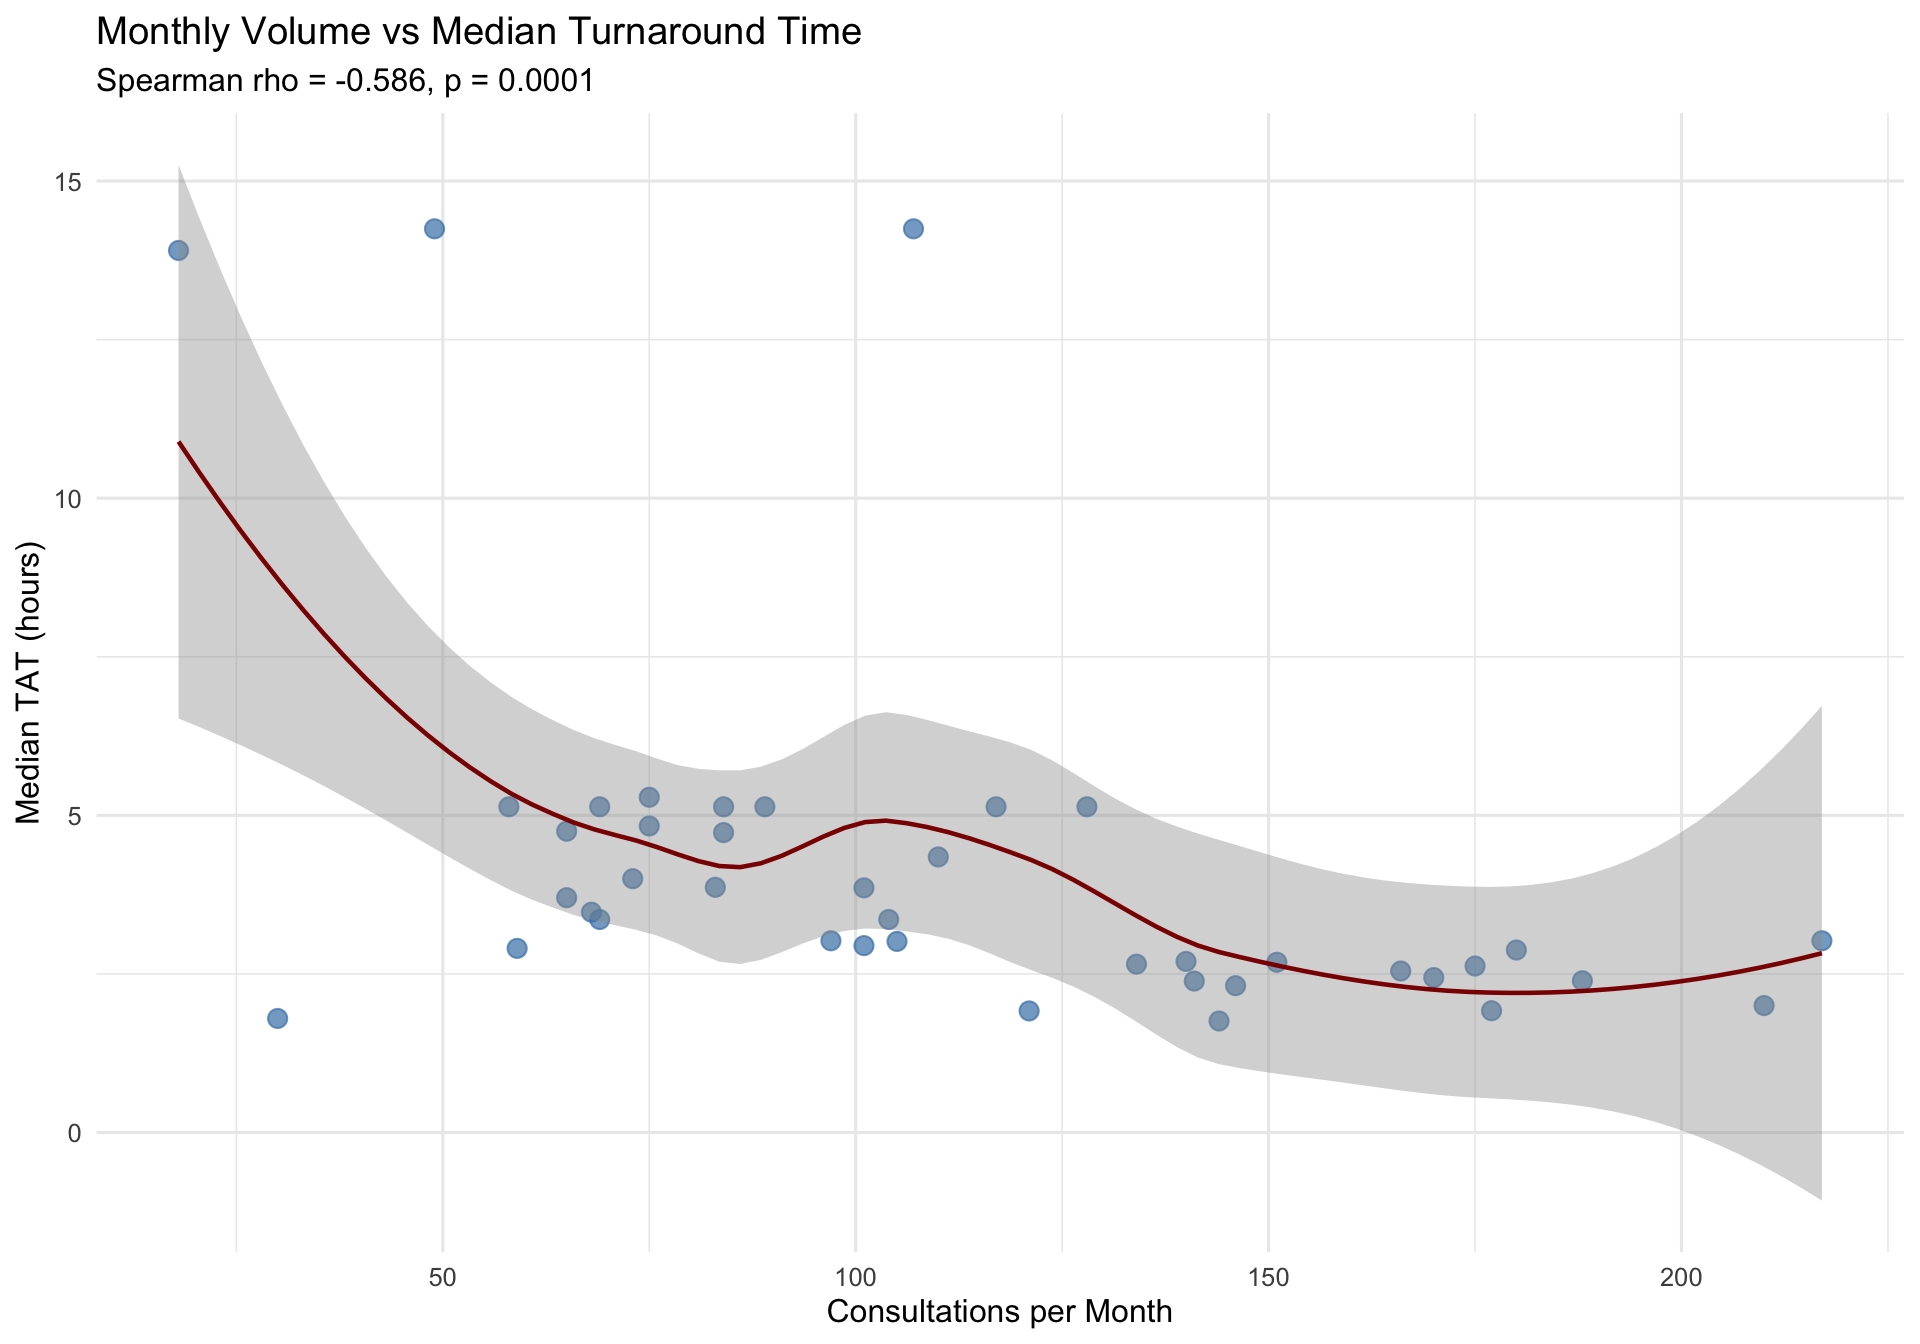
15.11.4 “Micro-Consult” Detection
If the Low Threshold Hypothesis holds, we expect the proportion of rapid consultations – what we term “micro-consults” – to increase over time. These are consultations resolved in under 1 hour or under 4 hours, suggesting quick confirmatory checks rather than deep diagnostic deliberation.
15.11.5 Formal Trend Tests (Autocorrelation/Seasonality-Adjusted Mann-Kendall)
We apply trend-free prewhitened Mann-Kendall tests (with monthly deseasonalization) to three monthly time series. The hypothesis predicts: (1) increasing volume (positive tau), (2) decreasing median TAT (negative tau), and (3) increasing proportion of sub-4h consultations (positive tau).
| Time Series | τ (Tau) | p-value | Lag-1 ρ | Expected Direction | Observed Direction | Significant | Supports Hypothesis |
|---|---|---|---|---|---|---|---|
| Monthly Volume | 0.536 | 1.19e-06 | 0.191 | Positive (increasing) | Increasing | Yes | Yes |
| Monthly Median TAT | -0.562 | 3.55e-07 | 0.251 | Negative (decreasing) | Decreasing | Yes | Yes |
| Monthly % Under 4h | 0.736 | 0.00e+00 | 0.164 | Positive (increasing) | Increasing | Yes | Yes |
15.11.6 Interpretation
Summary of Evidence for the Low Threshold Hypothesis:
The data provide substantial support for the Low Threshold Hypothesis. Of the three predicted trends, 3 out of 3 were confirmed by statistically significant adjusted Mann-Kendall tests.
The Spearman correlation between monthly volume and median TAT (rho = -0.586, p = 1e-04) confirms a significant negative relationship: months with higher consultation volume tend to have shorter turnaround times.
The friction-filter concept. In the analog world, physical effort acts as a friction filter — pathologists might rely on their own judgment for borderline cases rather than walk down the hall. In the digital world, clicking a button to share a case takes seconds, effectively removing this friction. The consequence, if the hypothesis holds, is a shift in the composition of consultations: the overall volume rises not because difficult cases become more common, but because easier cases that previously would have been handled alone now enter the consultation workflow as quick, confirmatory ‘micro-consults.’ This pattern has important implications for quality assurance — even if individual consultations are less intense on average, the aggregate effect on diagnostic accuracy could be substantial, as borderline cases that previously went unreviewed now receive a second pair of eyes.
15.12 Discussion: Literature Context
15.12.1 Consultation Rates in Context
The consultation rates observed in this study can be contextualized against published benchmarks from multi-institutional studies. The CAP Q-Probes data from 180 laboratories and 2,746 intradepartmental consultations established a baseline consultation rate of approximately 0.5% of surgical pathology cases (Renshaw et al. 2002). In these studies, the consulted pathologist confirmed the original diagnosis in 70.5% of cases, added significant diagnostic information in 15.9%, and identified a total discordance rate of 4.7% (1.0% major) (Farooq et al. 2021).
Renshaw et al. (Renshaw et al. 2002) established an early benchmark, finding that 4.3% of in-house consultations resulted in a diagnostic change, with approximately 1% being clinically significant. In a more recent study of mandatory intradepartmental peer review at a tertiary hospital, Solivas and Diwa (Solivas and Diwa 2024) reported a 3.1% discordance rate among 5,377 surgical pathology cases, with gastrointestinal, gynecologic, and head & neck pathology showing the most discordant cases.
The section-level variation in consultation rates observed here aligns with the well-documented subspecialty differences in diagnostic difficulty. Elmore et al. (Elmore et al. 2015) demonstrated that breast biopsy concordance among pathologists was only 75.3%, with atypia diagnoses achieving just 48% agreement. Peck et al. (Peck et al. 2018) reported that inaccurate diagnoses (major discordance) ranged from 3% to 9% among different specimen groups, with gynecology, dermatopathology, and gastrointestinal specimens presenting the greatest diagnostic challenge. These findings support the hypothesis that section-level consultation rates reflect inherent diagnostic complexity.
15.12.2 Digital Pathology and Consultation Workflows
This study was conducted in a fully digital pathology environment, which has important implications for consultation patterns. Hanna et al. (Hanna et al. 2019) demonstrated that digital pathology implementation reduced glass slide archive requests by 93%, off-site requests by 97%, and improved surgical case turnaround time by one day. Digital telepathology workflows at Mount Sinai Hospital reduced consultation turnaround from 86 hours to 35 minutes — a 98% reduction (Haghighi et al. 2021).
A systematic review and meta-analysis by Azam et al. (Azam et al. 2021) covering 25 studies and 10,410 histology samples showed 98.3% overall concordance between digital and light microscopy. Major discordances were primarily related to nuclear atypia assessment, dysplasia grading, and malignancy evaluation (57%), challenging diagnoses (26%), and identification of small objects (16%). These are precisely the types of cases most likely to prompt intradepartmental consultation.
During the COVID-19 pandemic, Hanna et al. (Hanna et al. 2020) validated remote digital pathology diagnosis, achieving 100% major diagnostic equivalency between digital and glass slide diagnoses across 108 cases (254 parts, 1,196 slides). The framework for integrating digital pathology into clinical practice (Hanna et al. 2022) and quality management systems for digital pathology operations (Ardon et al. 2023) provide the operational context in which the consultation patterns analyzed here occur.
15.12.3 Workload Implications
The per-pathologist consultation rate trends documented in this study connect to the broader literature on pathologist workload and workforce challenges. Bonert et al. (Bonert et al. 2021) found that workload units rose 23% over nine years while case volume decreased 6%, indicating increasing specimen complexity. The same group (Bonert et al. 2022) documented substantial workload inequality (Gini coefficients 0.05–0.23) within hospital groups, with high individual workload and maldistribution associated with significant absences and departures.
The declining pathologist workforce — a 17.5% decrease in active US pathologists from 2007 to 2017 (Metter et al. 2019) — increases the importance of efficient consultation workflows. No standardized workload measurement tool currently exists for pathologists (Hanna et al. 2024), and wRVU productivity varies 4- to 7-fold between subspecialties (Parkash et al. 2018), making consultation workload assessment an important complement to case-volume-based metrics.
15.12.4 Quality Assurance Framework
The CAP/ADASP guideline (Nakhleh et al. 2016) establishes intradepartmental consultation as a primary mechanism for interpretive diagnostic error reduction, recommending case review conferences and focused second review for high-risk cases. Goebel et al. (Goebel, Ettler, and Walsh 2018) found that all surveyed centers had formalized processes for documenting consultations, yet 92% of academic and 90% of community pathologists also requested undocumented informal consultations — suggesting that formal consultation tracking (as in this study) captures only a fraction of actual consultation activity.
Electronic LIS-based tracking systems, such as the module developed by Dunbar et al. (Dunbar et al. 2022) that processed 3,049 consultations in its first year, enable the type of systematic analysis presented here. The UCLA telepathology network (Chong et al. 2019) further demonstrated that digital infrastructure facilitates subspecialty consultation across geographically distributed sites with 97.5% concordance.