[1] TRUE11 Descriptive Statistics
This chapter provides a detailed descriptive analysis of the consultation dataset, covering pathologist activity, subspecialty distributions, consultation topics, and organ systems.
11.1 Pathologist Activity
11.1.1 Consultations Requested (Asker)
| Asker | Asker_Sub | Total_Requests |
|---|---|---|
| P8 | GIS | 754 |
| P13 | Uro | 684 |
| P10 | Gyn | 434 |
| P4 | GIS | 345 |
| P18 | Lung | 319 |
| P2 | BST | 275 |
| P28 | Hemato | 241 |
| P3 | General | 228 |
| P17 | Skin | 207 |
| P21 | Gyn | 197 |
| P9 | GIS | 194 |
| P22 | General | 185 |
| P5 | Hemato | 176 |
| P11 | Pancreas | 171 |
| P1 | Gyn | 158 |
11.1.2 Consultations Answered (Responder)
| Responder | Responder_Sub | Total_Responses |
|---|---|---|
| P5 | Hemato | 751 |
| P9 | GIS | 696 |
| P2 | BST | 684 |
| P11 | Pancreas | 522 |
| P23 | GIS | 407 |
| P21 | Gyn | 399 |
| P17 | Skin | 362 |
| P8 | GIS | 348 |
| P33 | — | 261 |
| P6 | GIS | 254 |
| P19 | Breast | 227 |
| P10 | Gyn | 216 |
| P28 | Hemato | 124 |
| P24 | BST | 120 |
| P27 | Breast | 94 |
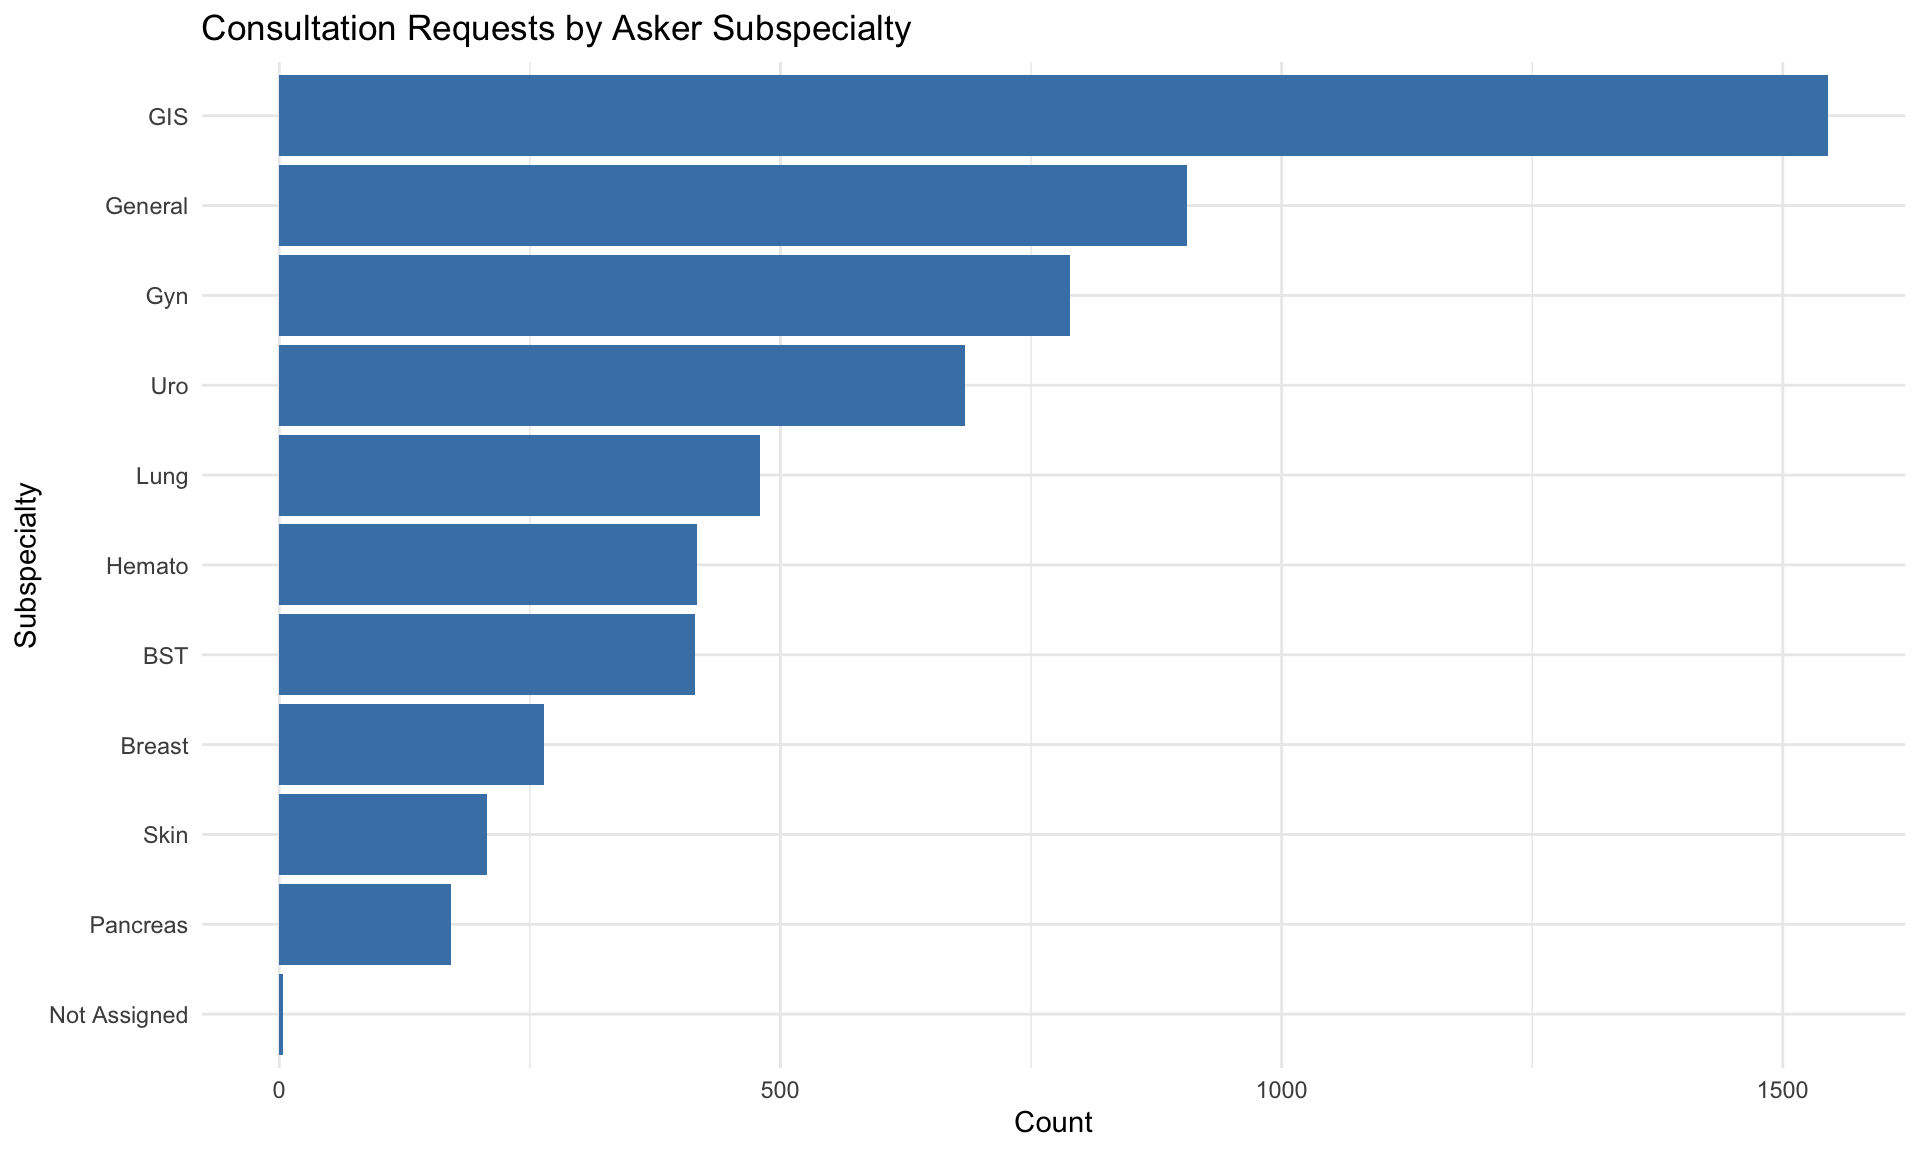
11.2 Subspecialty Distribution
Distribution of consultation volume based on the subspecialty of the Asker.
11.3 Consultation Categories (13-Category Analysis)
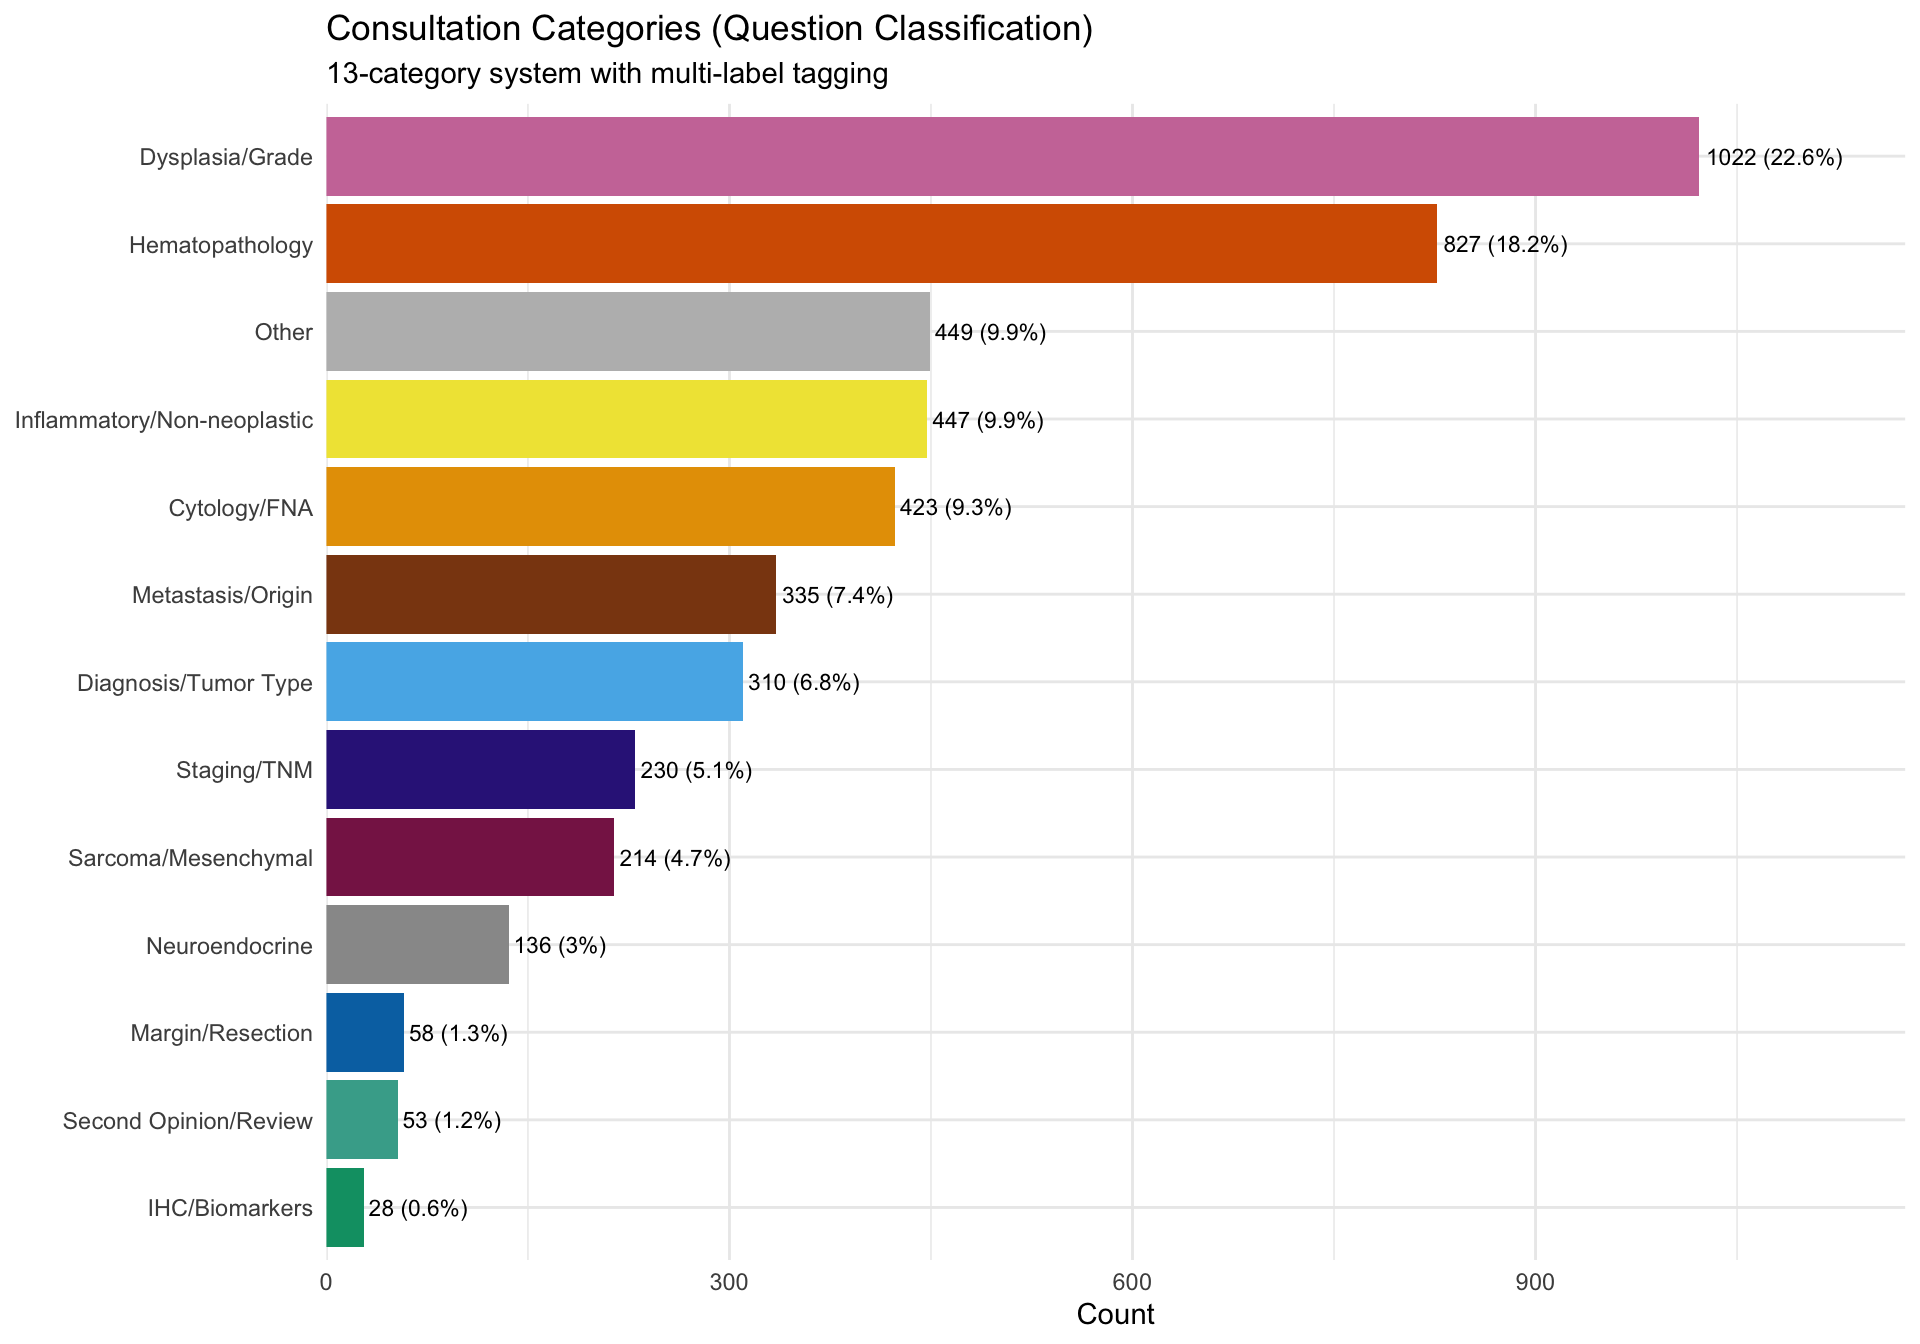
Analysis of consultation topics using a 13-category classification system with multi-label tagging.
| Category | Cases | Percentage (%) |
|---|---|---|
| Dysplasia/Grade | 1022 | 22.6 |
| Hematopathology | 827 | 18.2 |
| Other | 449 | 9.9 |
| Inflammatory/Non-neoplastic | 447 | 9.9 |
| Cytology/FNA | 423 | 9.3 |
| Metastasis/Origin | 335 | 7.4 |
| Diagnosis/Tumor Type | 310 | 6.8 |
| Staging/TNM | 230 | 5.1 |
| Sarcoma/Mesenchymal | 214 | 4.7 |
| Neuroendocrine | 136 | 3.0 |
| Margin/Resection | 58 | 1.3 |
| Second Opinion/Review | 53 | 1.2 |
| IHC/Biomarkers | 28 | 0.6 |
Distribution of Consultation Categories Using the 13-Category Classification System
NoteInterpretation
This chart shows what types of questions pathologists most commonly ask each other about. The most frequent categories reveal the diagnostic areas where peer consultation is most needed. A single consultation can be tagged with multiple categories, so the total exceeds the number of consultations.
11.3.1 Multi-Tag Analysis
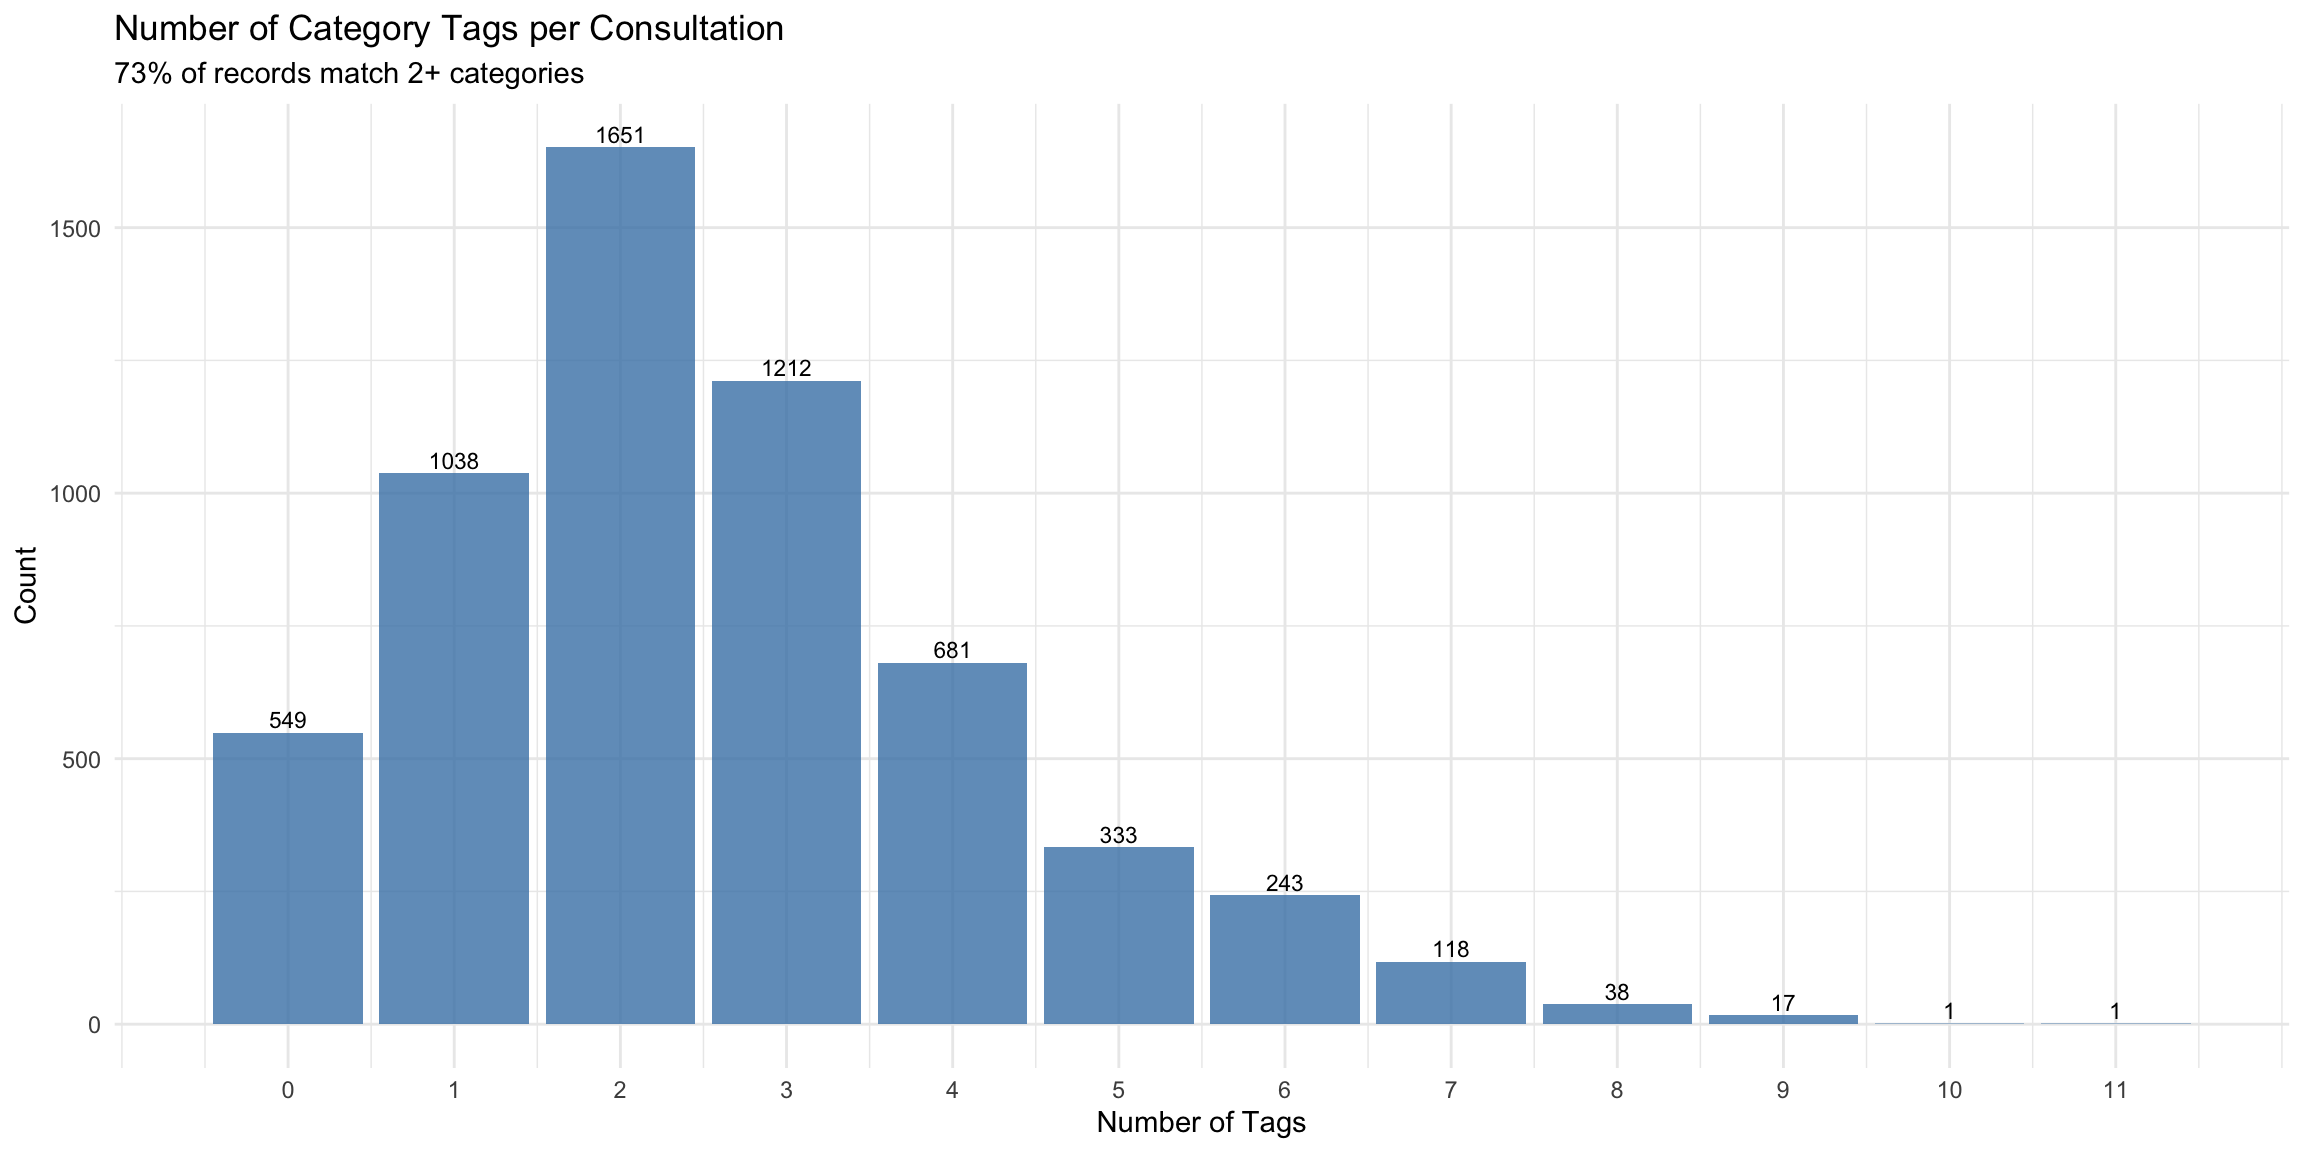
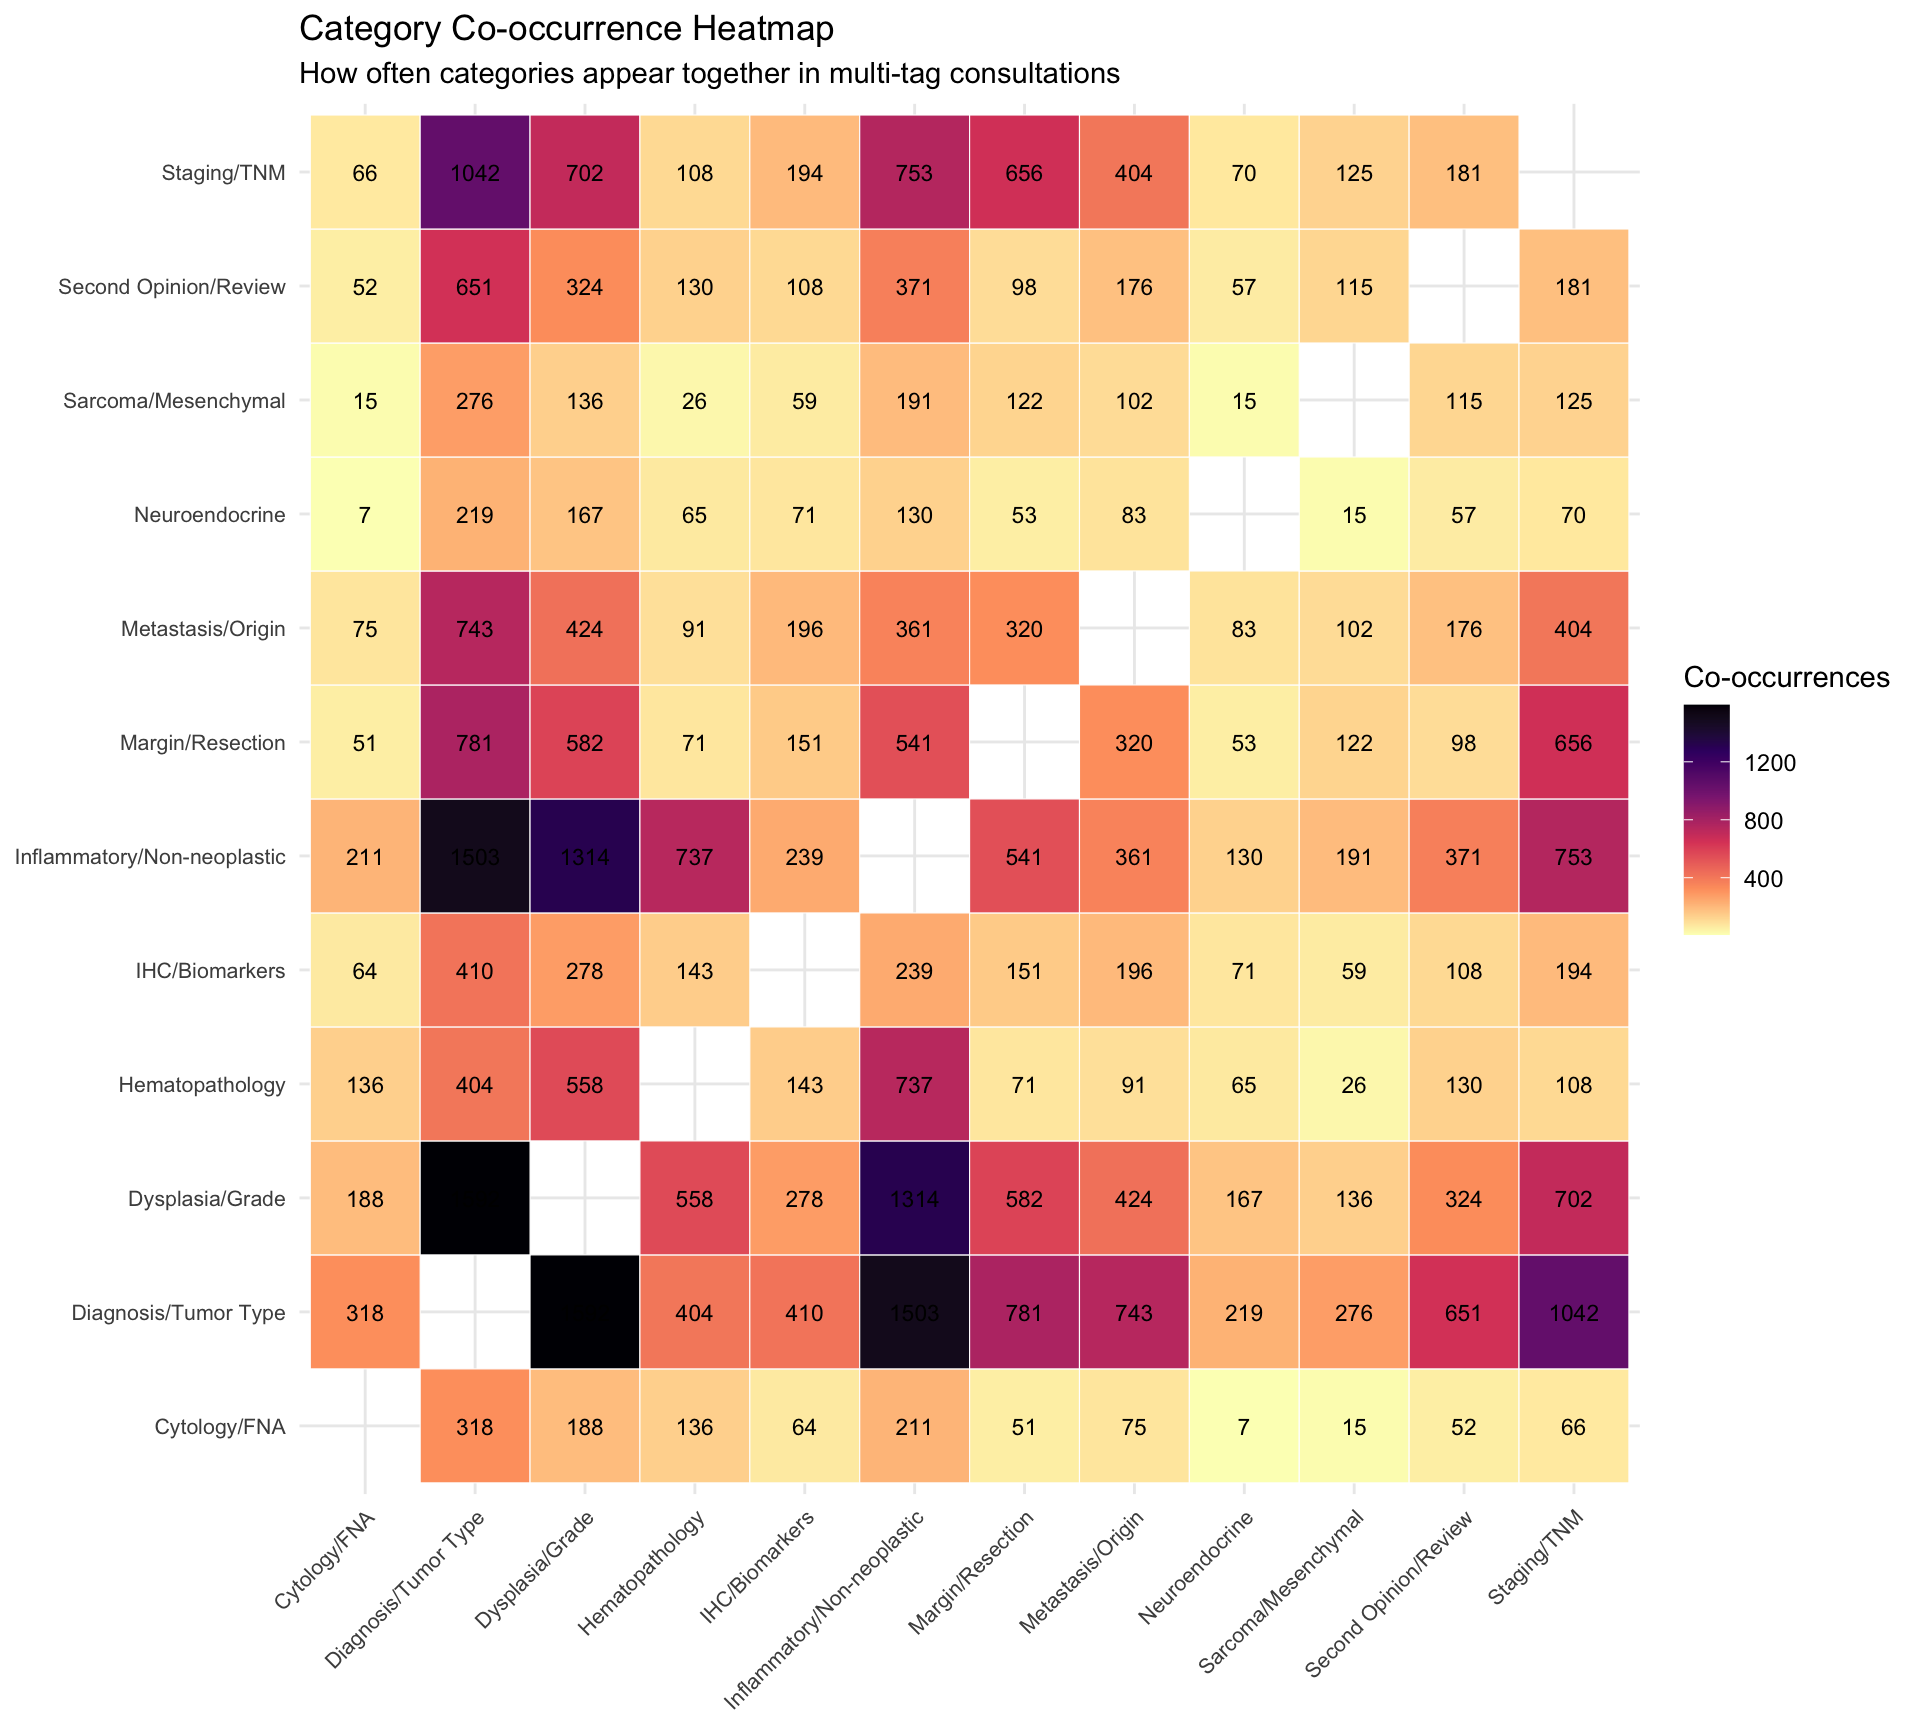
Each consultation may match multiple categories. The tag count distribution and co-occurrence patterns reveal the complexity of consultation questions.
NoteInterpretation
This heatmap shows which consultation topics tend to appear together in the same case. Darker cells indicate category pairs that frequently co-occur. For example, a high co-occurrence between “Diagnosis/Tumor Type” and “IHC/Biomarkers” would mean these questions are often asked together, reflecting the integrated nature of diagnostic workup in those cases.
11.3.2 Category x Responder Heatmap
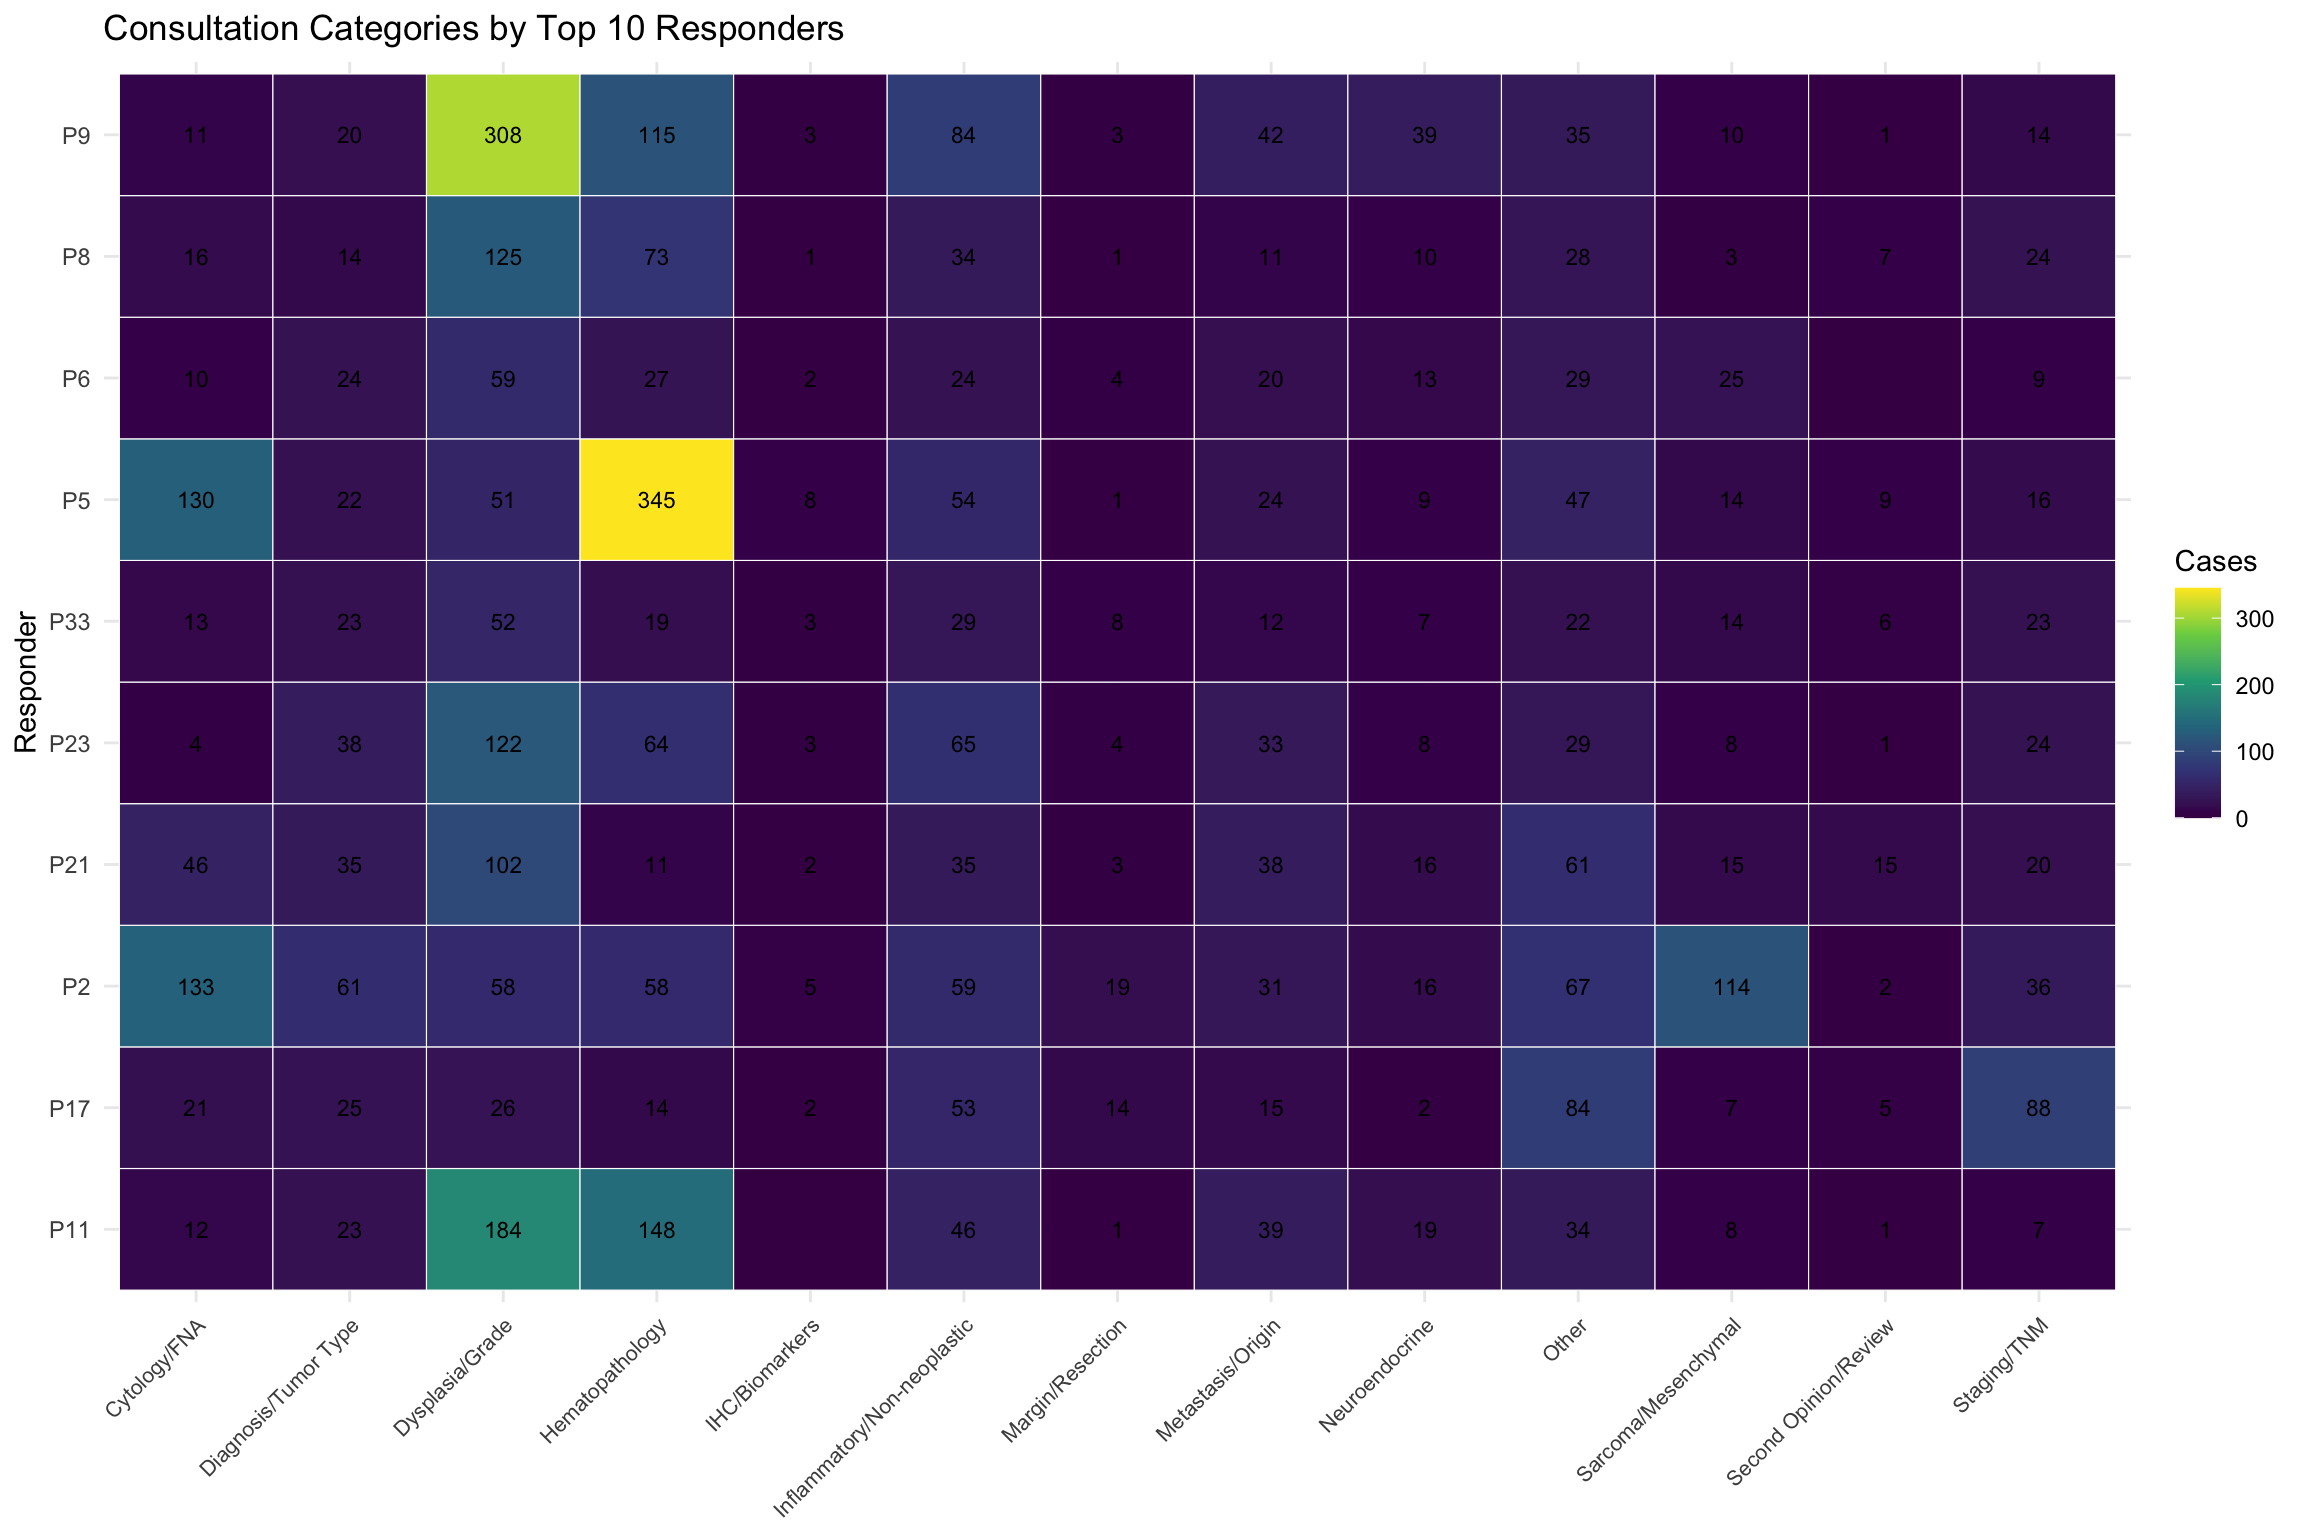
Distribution of consultation categories across the most active responders.
11.3.3 Category Turnaround Time
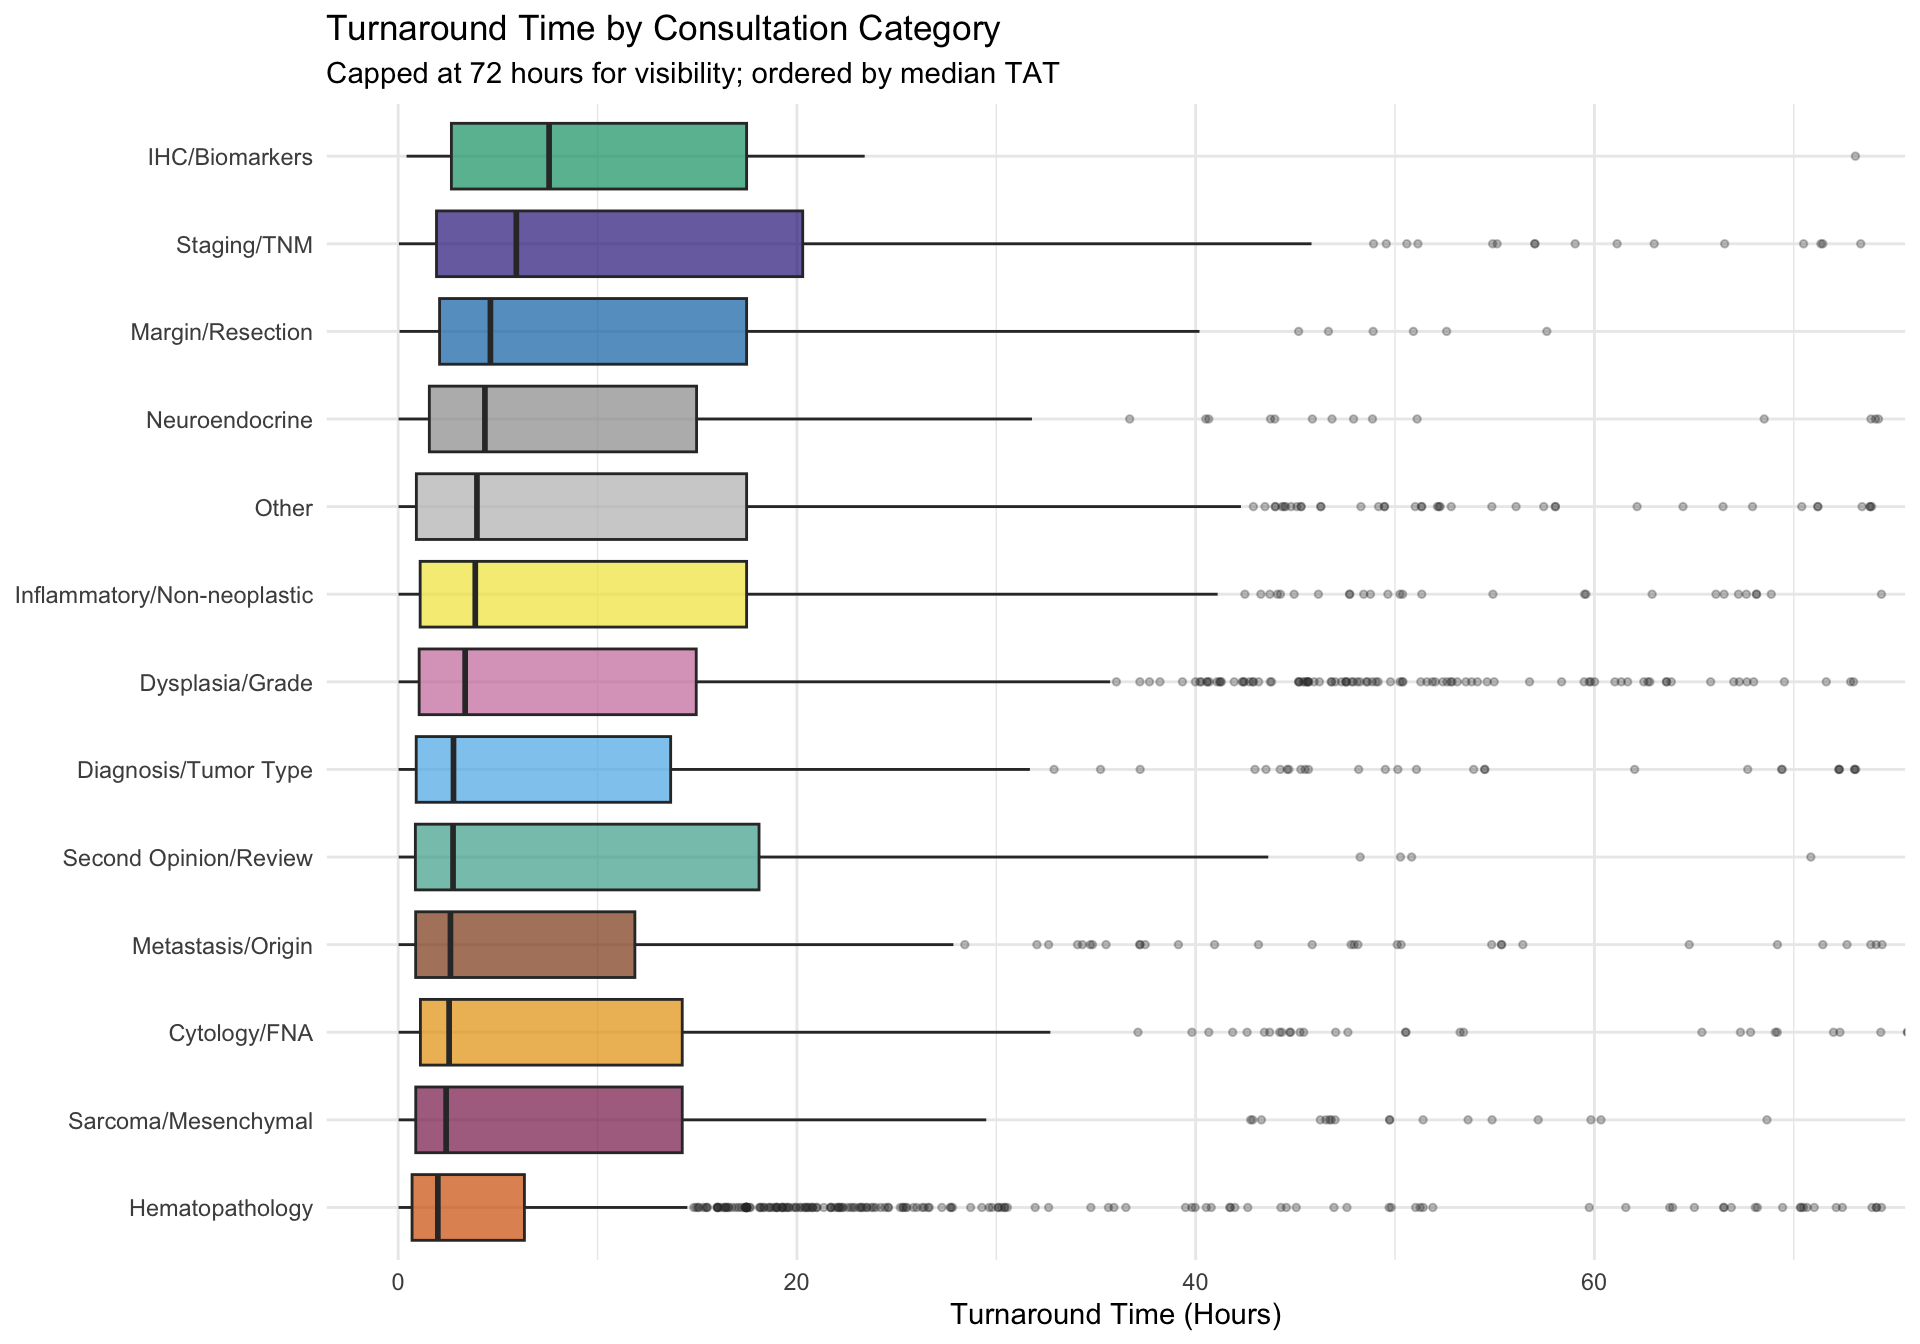
Turnaround time distribution by consultation category reveals differences in diagnostic complexity.
NoteInterpretation
This boxplot compares how quickly different types of consultations are answered. Categories at the top take longer on average (higher median turnaround time), which may reflect greater diagnostic complexity. The box shows the middle 50% of response times, and dots beyond the whiskers are unusually fast or slow outliers. Categories with wider boxes have more variable response times.
11.4 Organ System Analysis
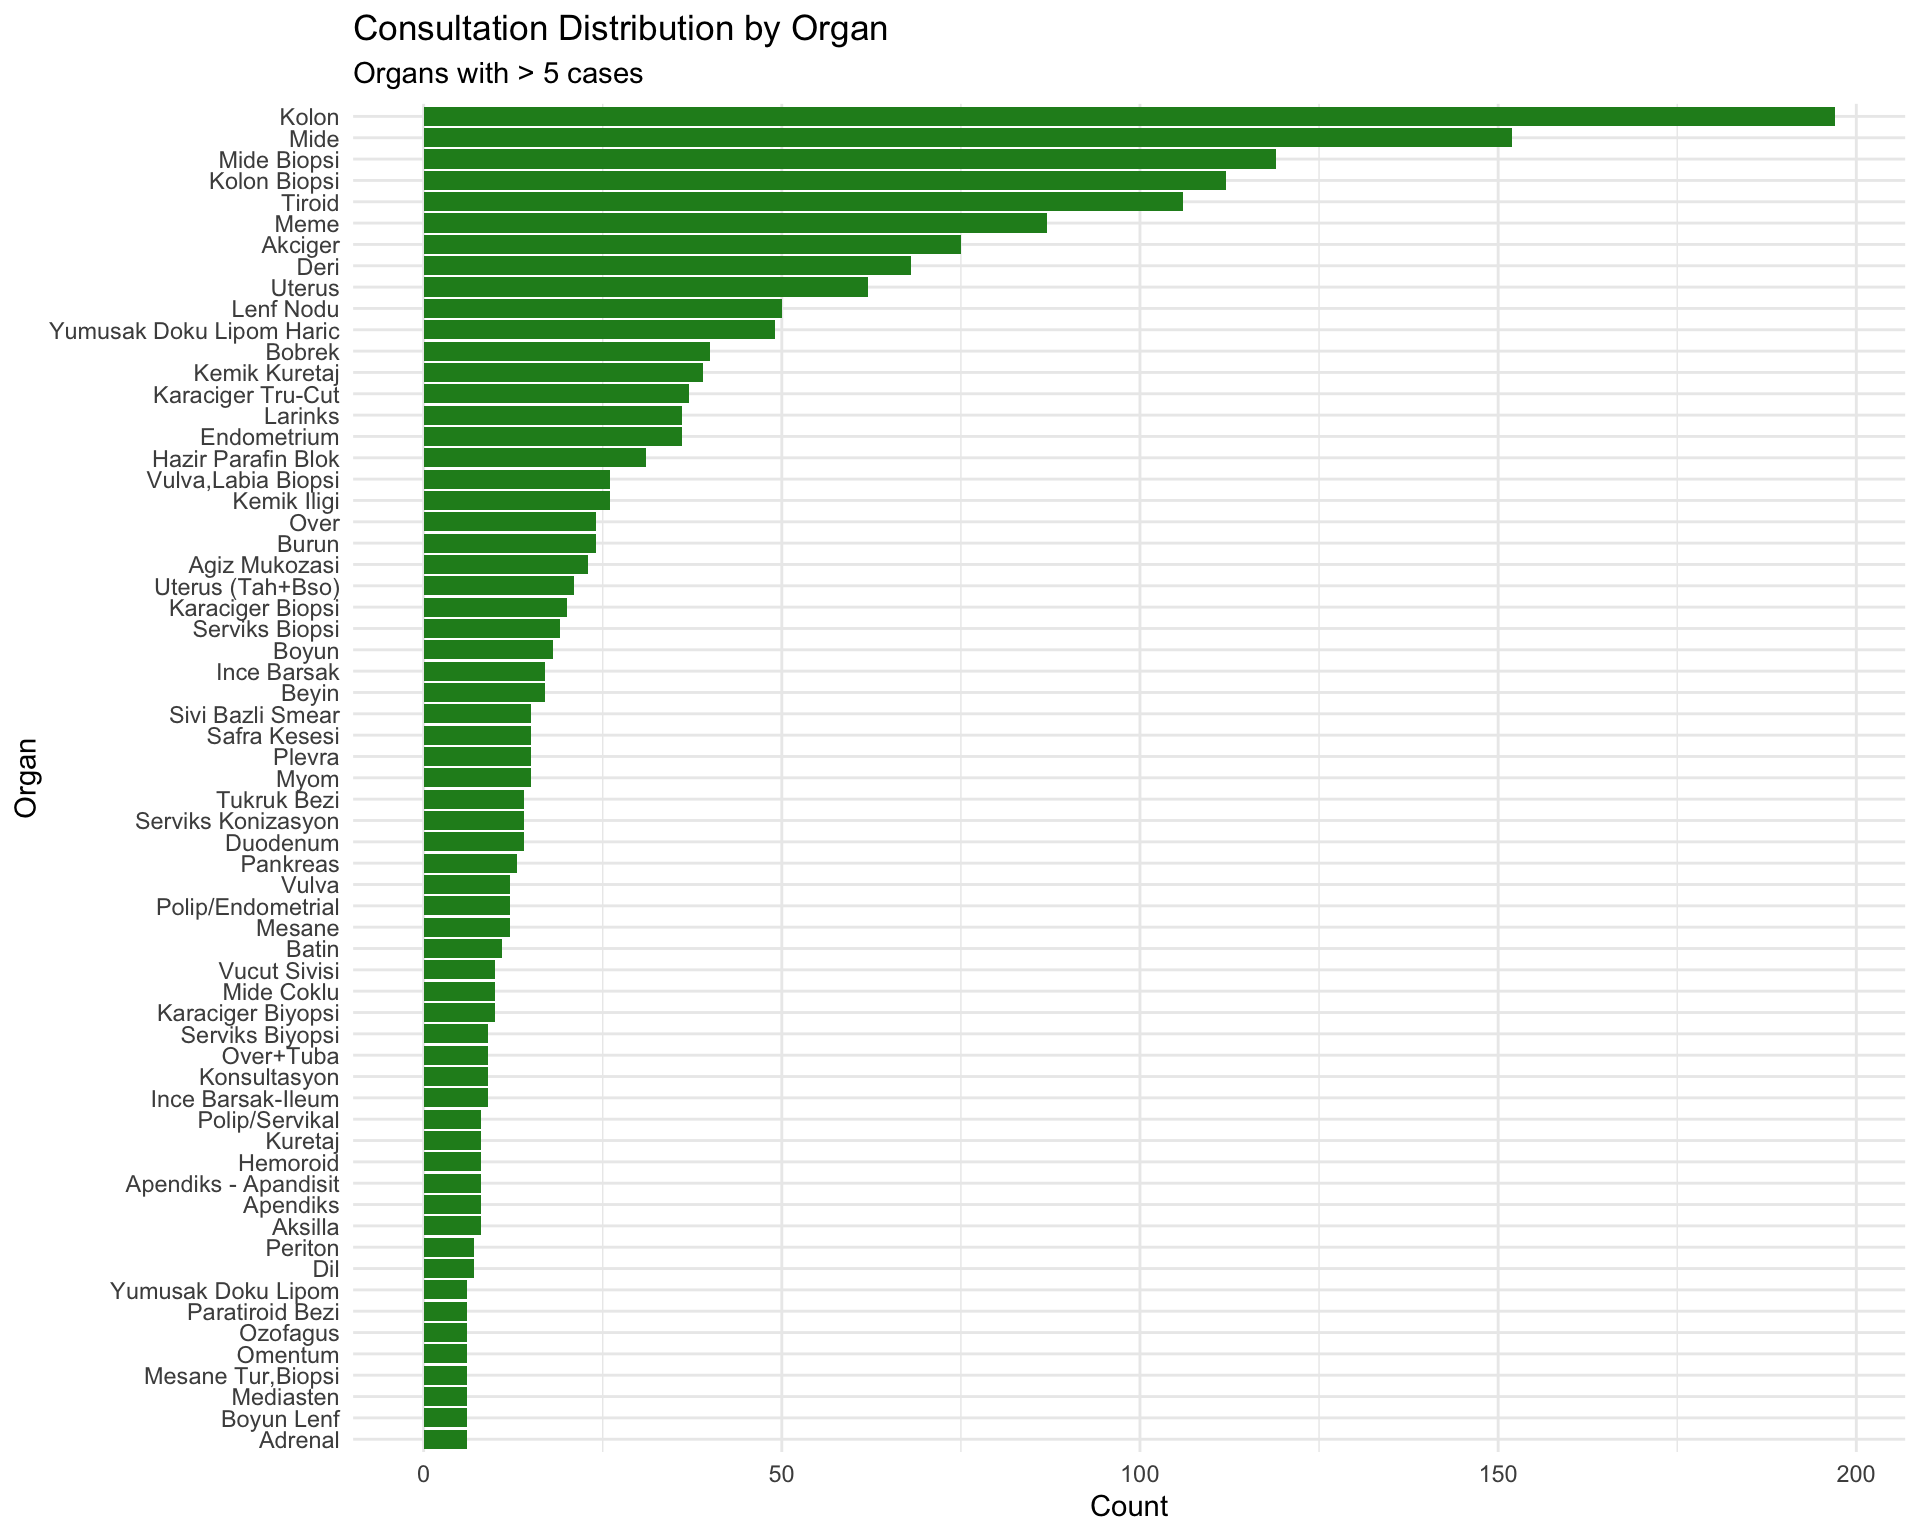
Distribution of cases by Organ system (derived from ‘Paylasilan Vakalar’).
| Organ | n |
|---|---|
| Kolon | 197 |
| Mide | 152 |
| Mide Biopsi | 119 |
| Kolon Biopsi | 112 |
| Tiroid | 106 |
| Meme | 87 |
| Akciger | 75 |
| Deri | 68 |
| Uterus | 62 |
| Lenf Nodu | 50 |
| Yumusak Doku Lipom Haric | 49 |
| Bobrek | 40 |
| Kemik Kuretaj | 39 |
| Karaciger Tru-Cut | 37 |
| Endometrium | 36 |
| Larinks | 36 |
| Hazir Parafin Blok | 31 |
| Kemik Iligi | 26 |
| Vulva,Labia Biopsi | 26 |
| Burun | 24 |
11.5 Integrated Analysis
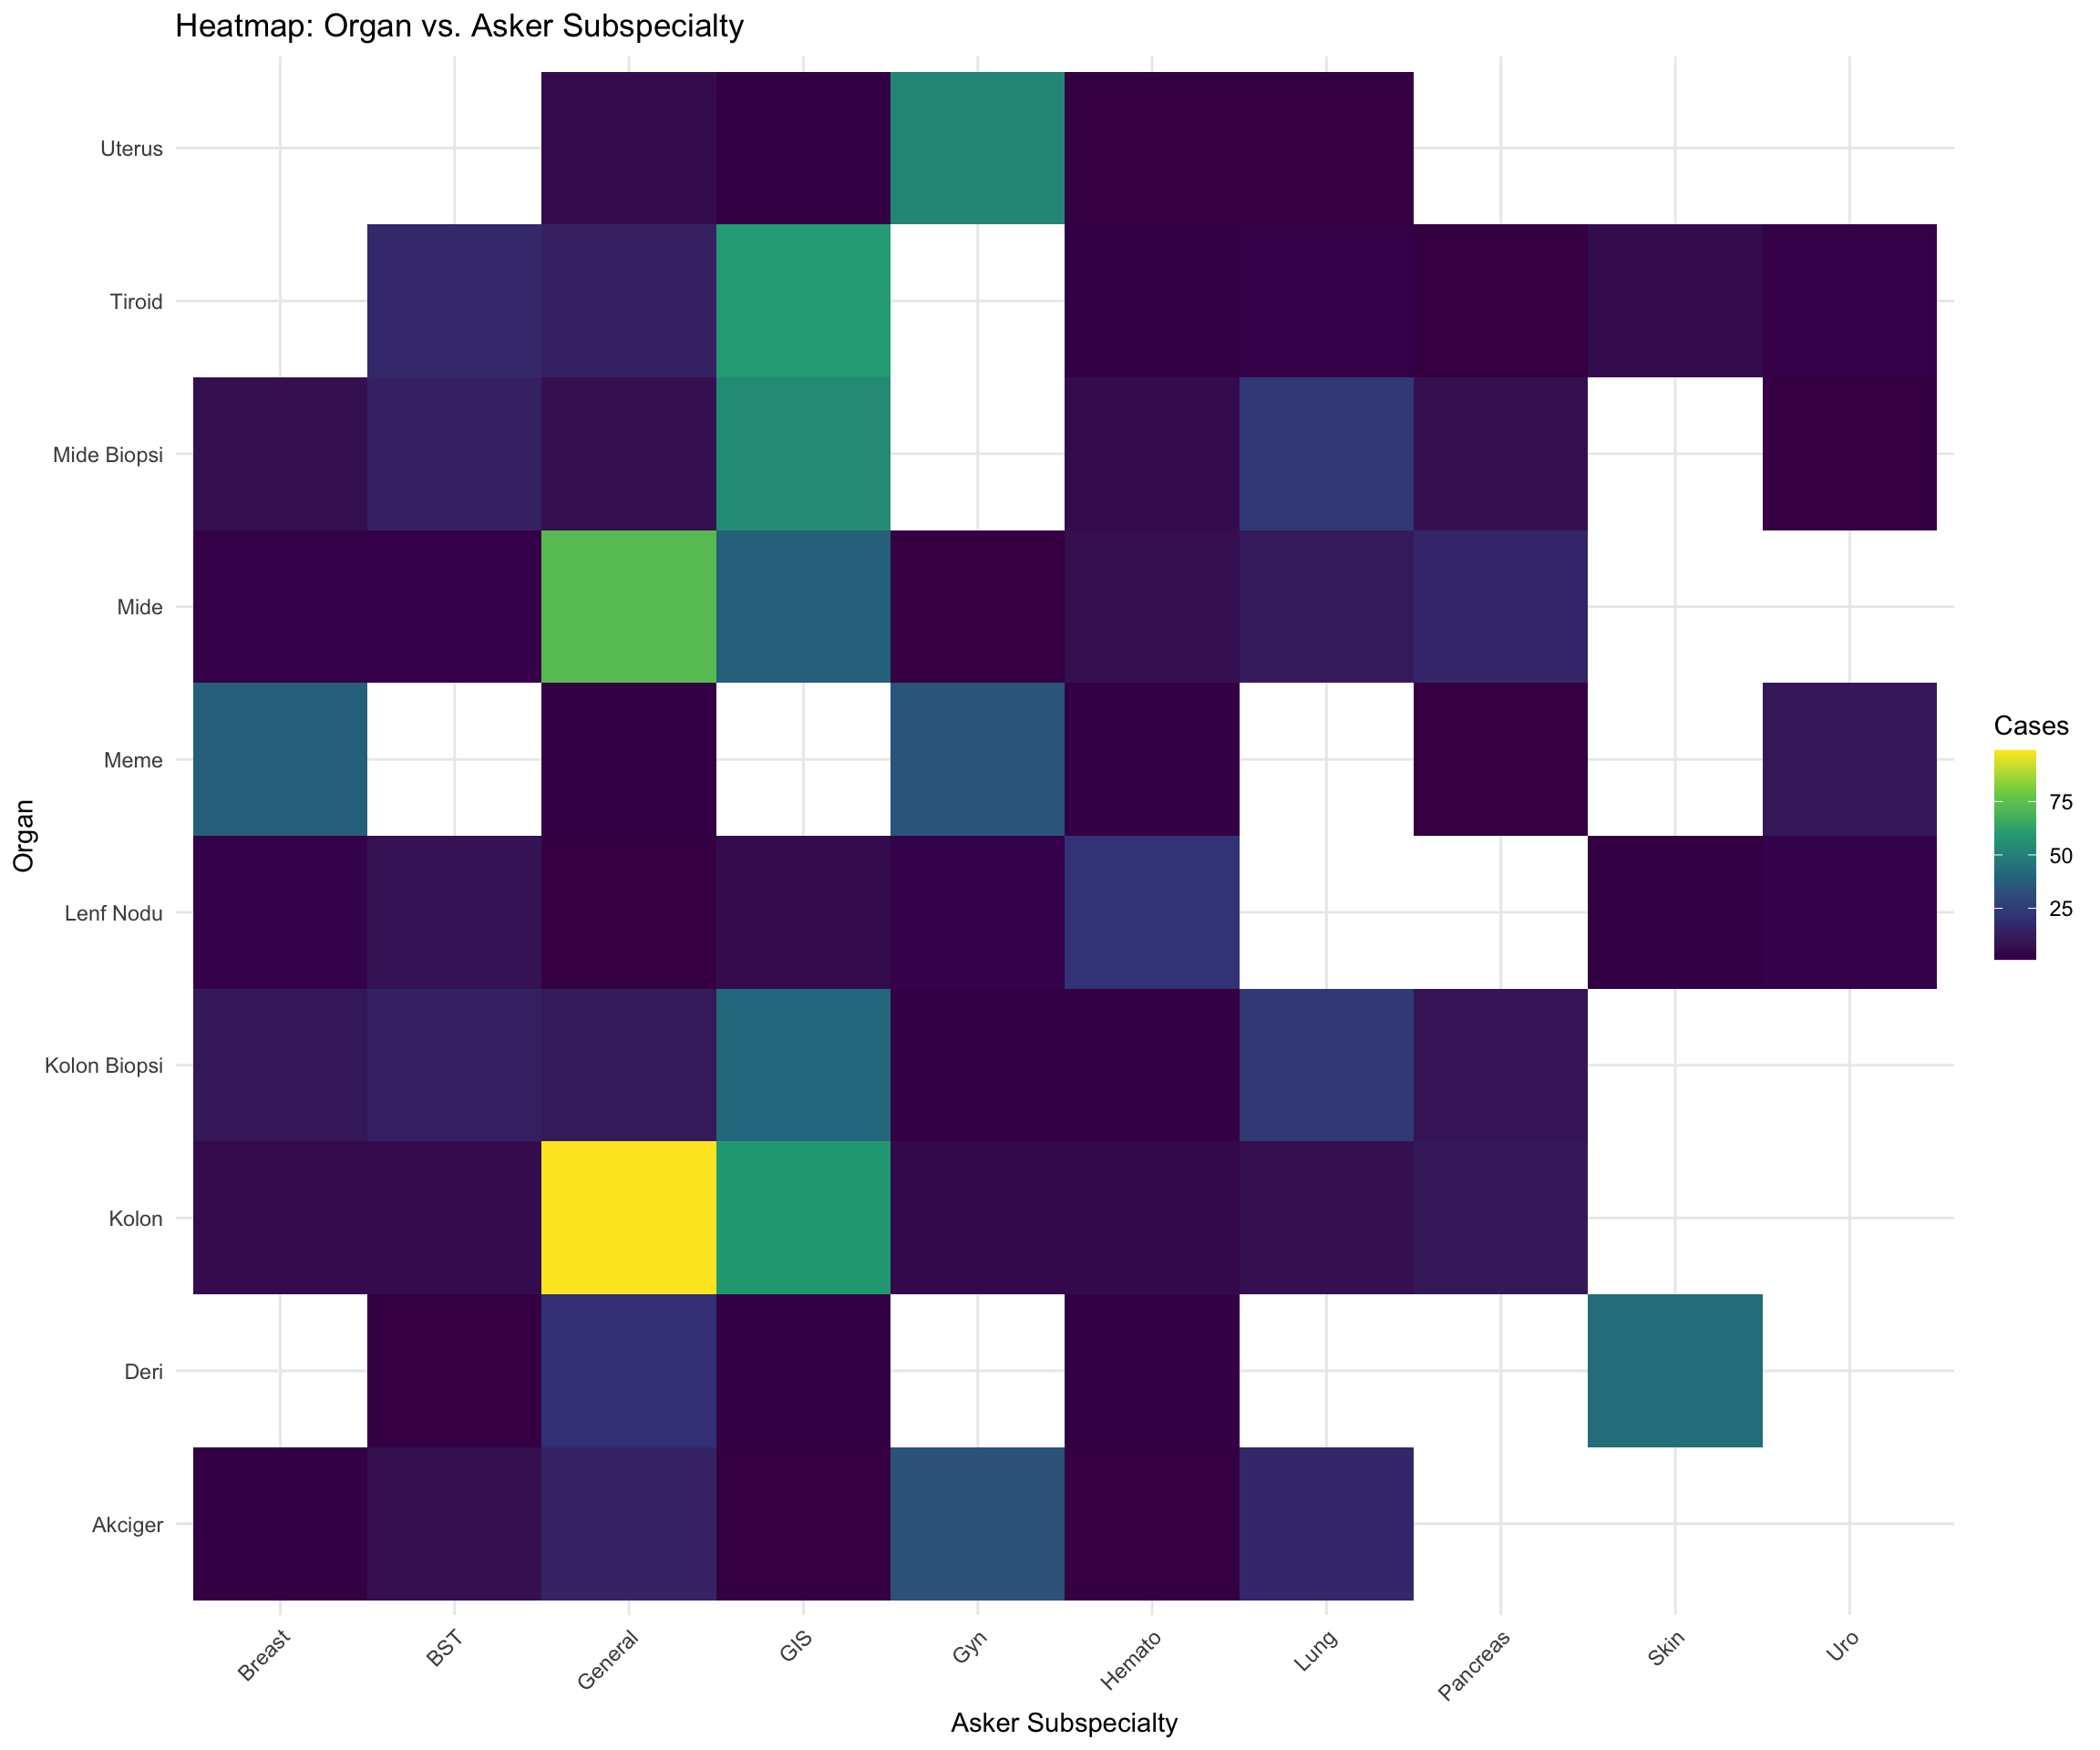
11.5.1 Organ vs. Subspecialty
Which organs are consulted by which subspecialties?