[1] TRUE22 Executive Dashboard
This chapter provides a high-level summary of key findings and metrics for executive review.
22.1 At-a-Glance Metrics
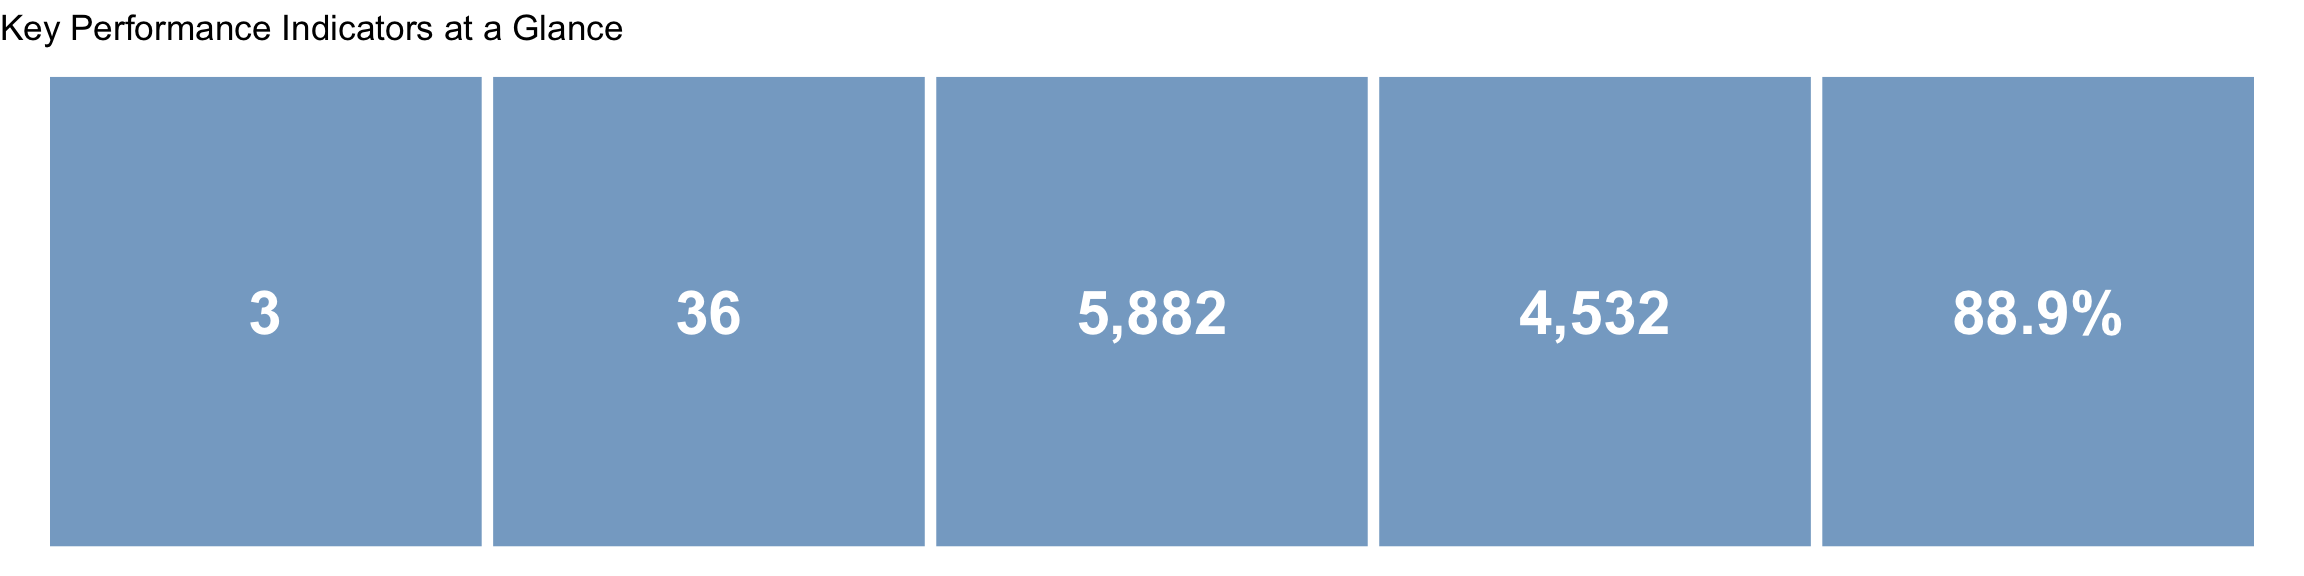
| Metric | Value |
|---|---|
| Total Consultations | 5,882 |
| Unique Cases | 4,532 |
| Pathologists | 36 |
| Median TAT (hours) | 3 |
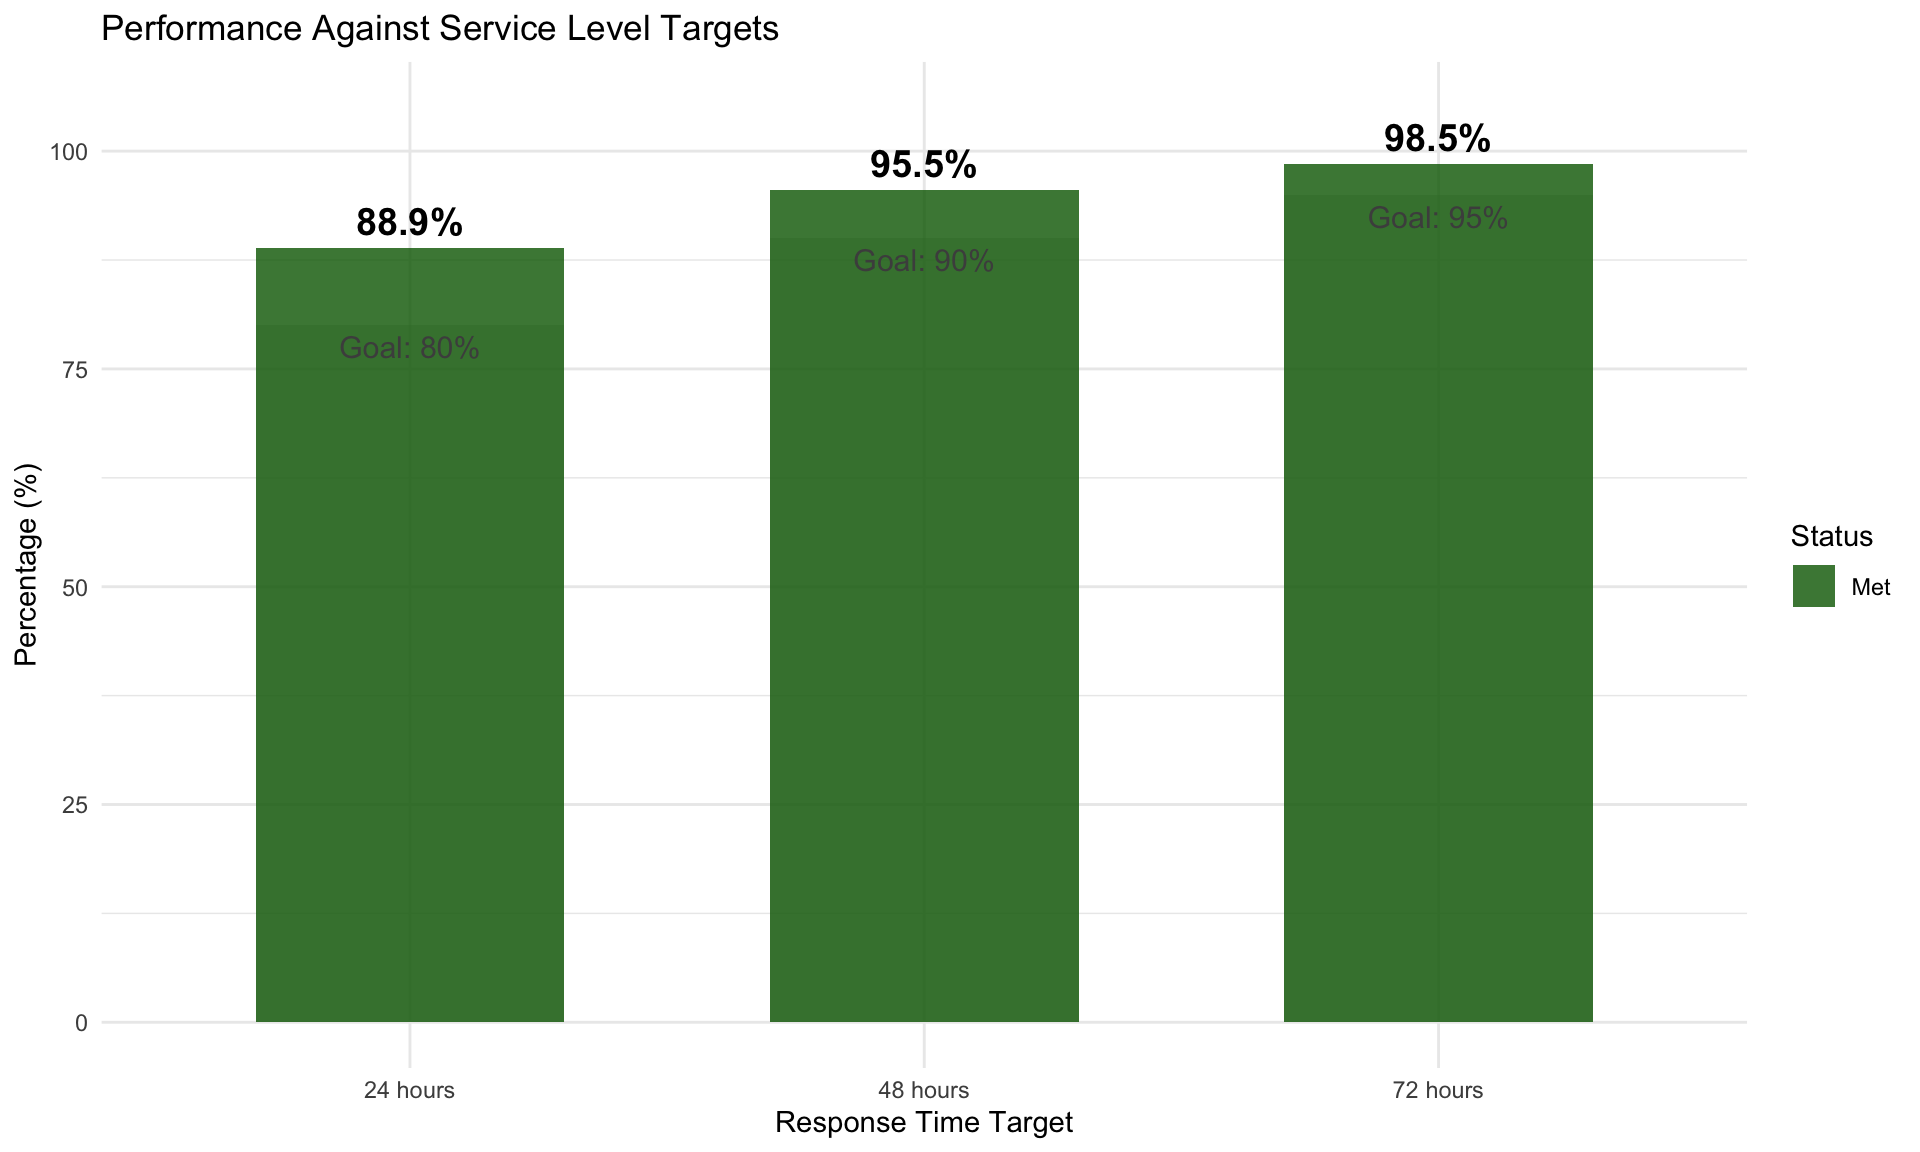
| Within 24h (%) | 88.9% |
22.2 Performance Against Targets
22.3 Trend Summary
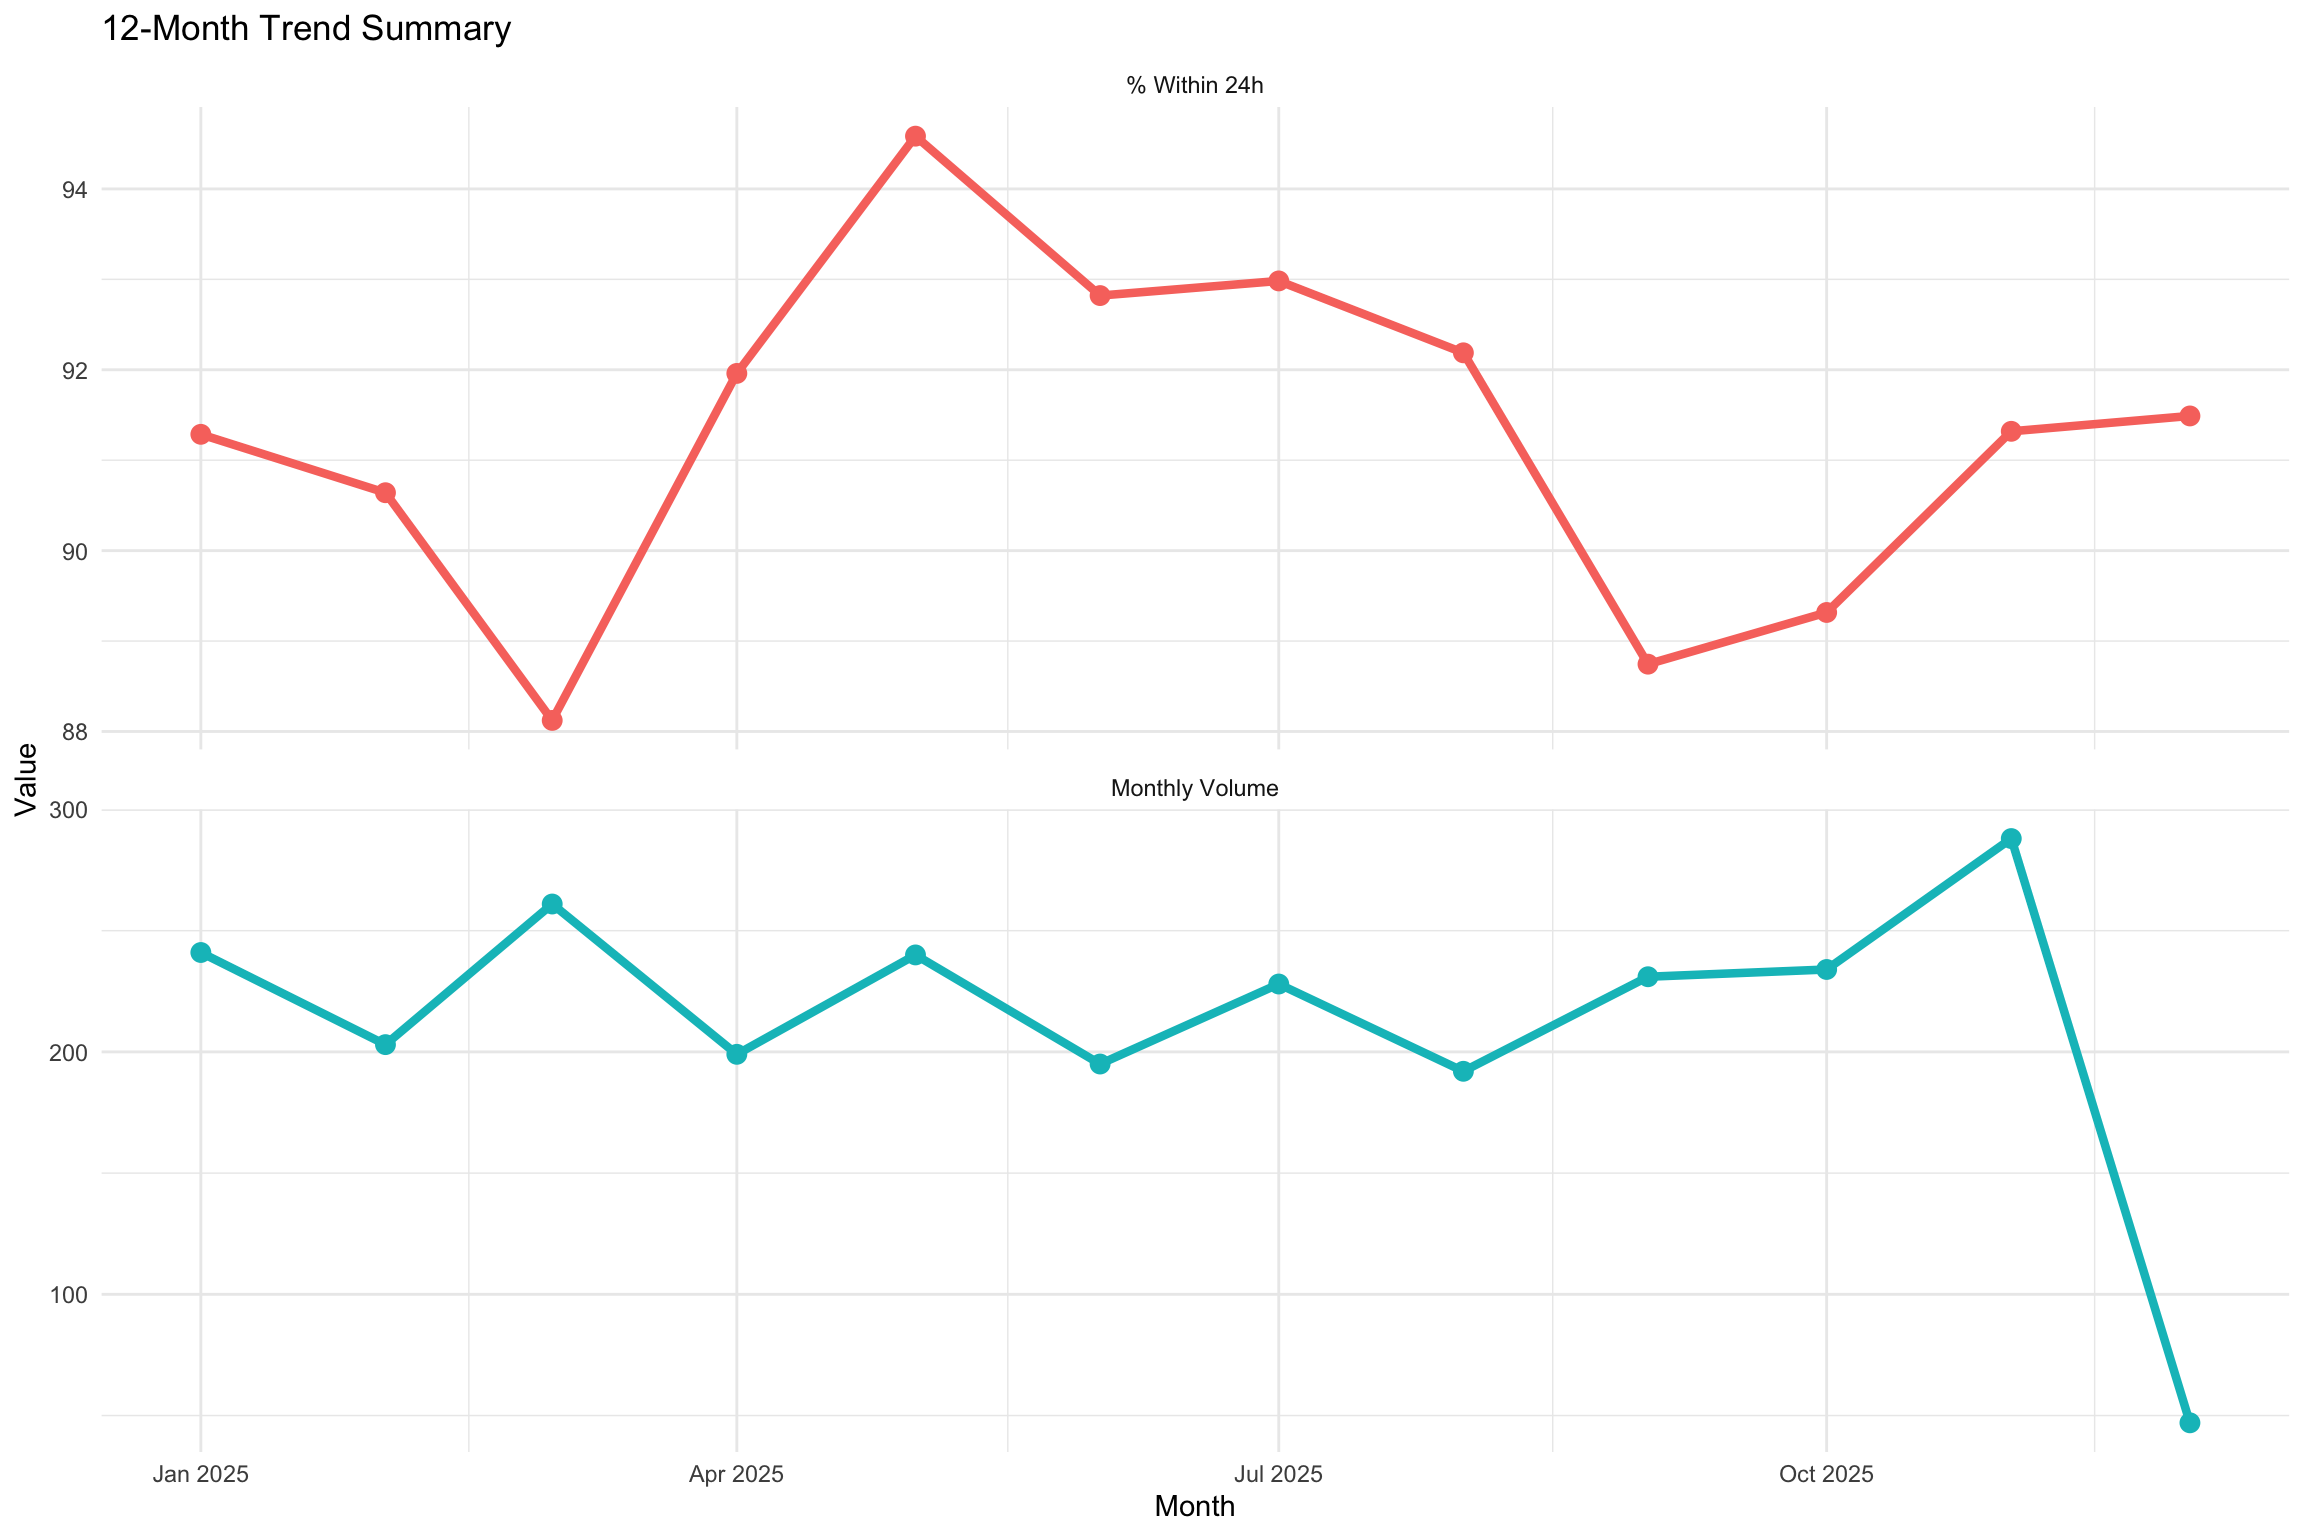
22.3.1 Volume and TAT Trends (Last 12 Months)
22.4 Top Performers and Concerns
22.4.1 Top 5 Most Consulted Experts
| Rank | Responder | Consultations |
|---|---|---|
| 1 | P5 | 751 |
| 2 | P9 | 696 |
| 3 | P2 | 684 |
| 4 | P11 | 522 |
| 5 | P23 | 407 |
22.4.2 Fastest Responders (Among Top 10 by Volume)
| Rank | Responder | Consultations | Median TAT (hrs) |
|---|---|---|---|
| 1 | P11 | 522 | 1.672639 |
| 2 | P5 | 751 | 1.987778 |
| 3 | P2 | 684 | 2.074722 |
| 4 | P23 | 407 | 3.023056 |
| 5 | P8 | 348 | 3.358056 |
22.4.3 Cases Requiring Attention
No cases exceed 1 week response time. Excellent performance!22.5 Network Insights
| Metric | Value |
|---|---|
| Unique Askers | 33.0 |
| Unique Responders | 32.0 |
| Unique Consultation Pairs | 463.0 |
| Average Consultations per Pair | 12.7 |
22.6 Quality Score
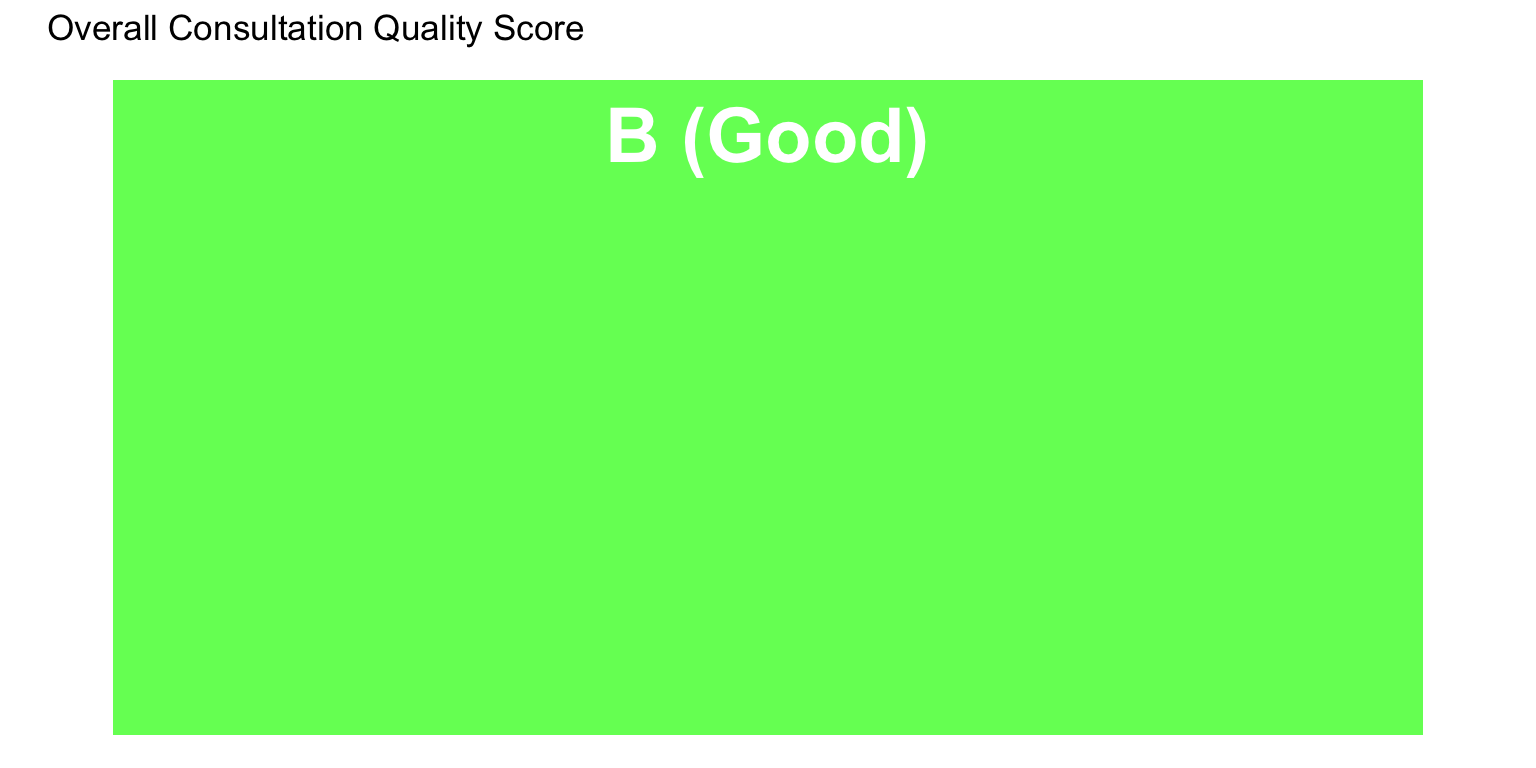
Overall quality score based on multiple factors:
| Component | Weight | Score | Weighted_Score |
|---|---|---|---|
| % Within 24h | 30% | 100.0 | 30.0 |
| % Within 48h | 20% | 100.0 | 20.0 |
| Median TAT | 20% | 93.7 | 18.7 |
| Consistency | 15% | 21.8 | 3.3 |
| Network Engagement | 15% | 100.0 | 15.0 |
22.6.1 Overall Quality Score: 87 / 100
Grade: B (Good)
22.7 Action Items
| Priority | Action | Target_Owner |
|---|---|---|
| MEDIUM | Address workload distribution inequality | Operations Manager |
22.8 Executive Summary
Study Period: August 2022 to December 2025
Key Findings:
- 5,882 total consultations were completed during the study period
- 4532 unique cases received consultation
- 36 pathologists participated in the consultation network
- Median turnaround time: 3 hours
- 88.9% of consultations completed within 24 hours
- Overall quality score: 87/100 (B (Good))
Status: The consultation service is performing well overall. Continue monitoring trends and maintain current practices.