[1] TRUE12 Quality Metrics and Performance Indicators
This chapter presents key performance indicators (KPIs) for monitoring and improving consultation quality. Turnaround time (TAT) is widely recognized as a critical metric in surgical pathology quality assessment (Sharma et al. 2025). The College of American Pathologists (CAP) Q-Probes studies have established TAT benchmarks for various specimen types (Volmar et al. 2015), and quality management systems in digital pathology operations provide frameworks for monitoring performance (Ardon et al. 2023). Adherence to interpretive error reduction guidelines further reinforces the importance of systematic quality metrics (Nakhleh et al. 2016). Interrupted time series methods, when properly applied with attention to autocorrelation and seasonality, offer a robust framework for evaluating whether quality improvement interventions have produced sustained change in these metrics (Hategeka et al. 2020; Penfold and Zhang 2013).
12.1 Key Performance Indicators (KPIs)
12.1.1 Overall Performance Targets
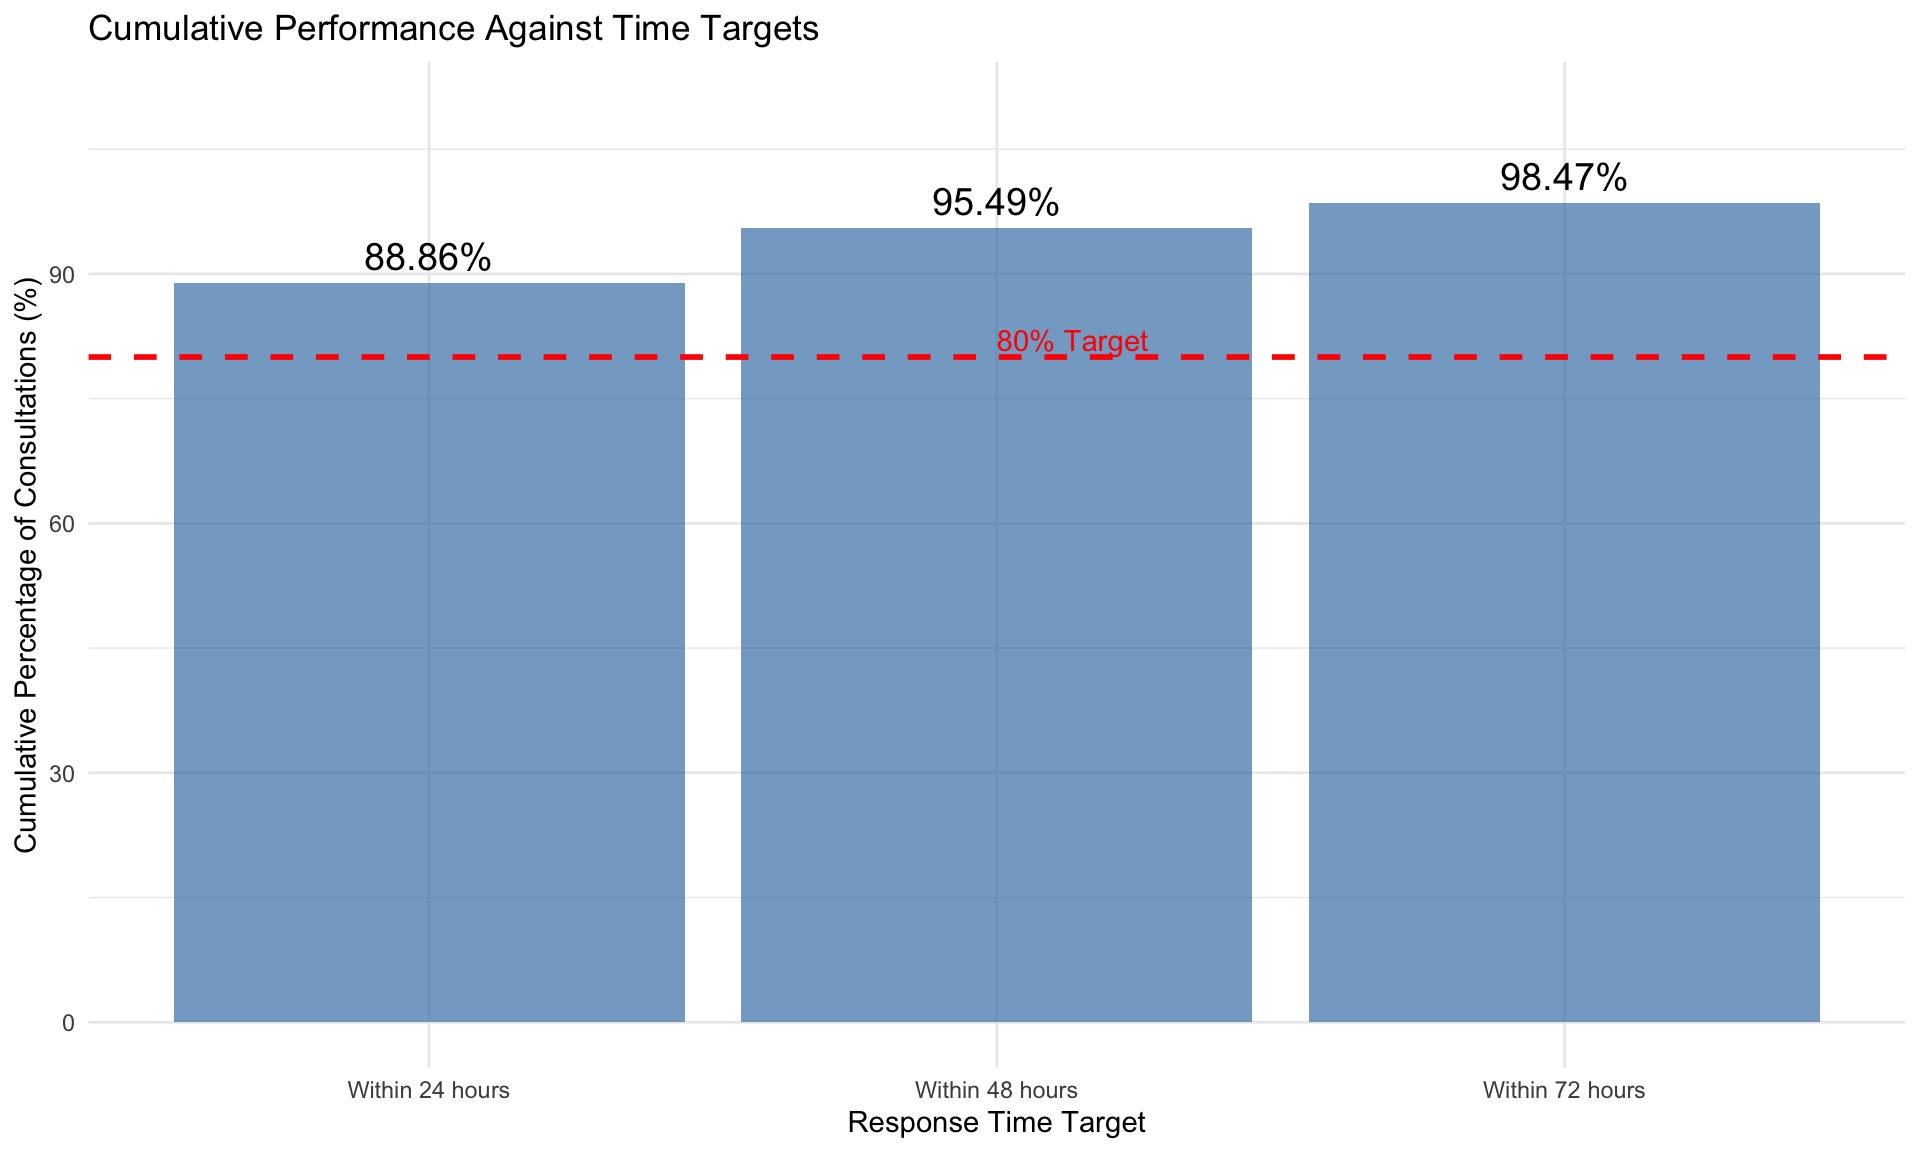
The 24-hour, 48-hour, and 72-hour thresholds used below are institutional benchmarks for intradepartmental consultation responsiveness. While the College of American Pathologists (CAP) does not prescribe specific TAT targets for intradepartmental consultations, 24 hours is a commonly adopted same-day/next-day service goal, and 48-72 hours aligns with routine second-opinion expectations in pathology practice.
| Target | Target_Hours | Count | Percentage | Cumulative_Percentage |
|---|---|---|---|---|
| Within 24 hours | 24 | 5227 | 88.86 | 88.86 |
| 24-48 hours | 48 | 390 | 6.63 | 95.49 |
| 48-72 hours | 72 | 175 | 2.98 | 98.47 |
| Over 72 hours | Inf | 90 | 1.53 | 100.00 |
12.1.2 Visual Performance Dashboard
12.2 Monthly Performance Trends
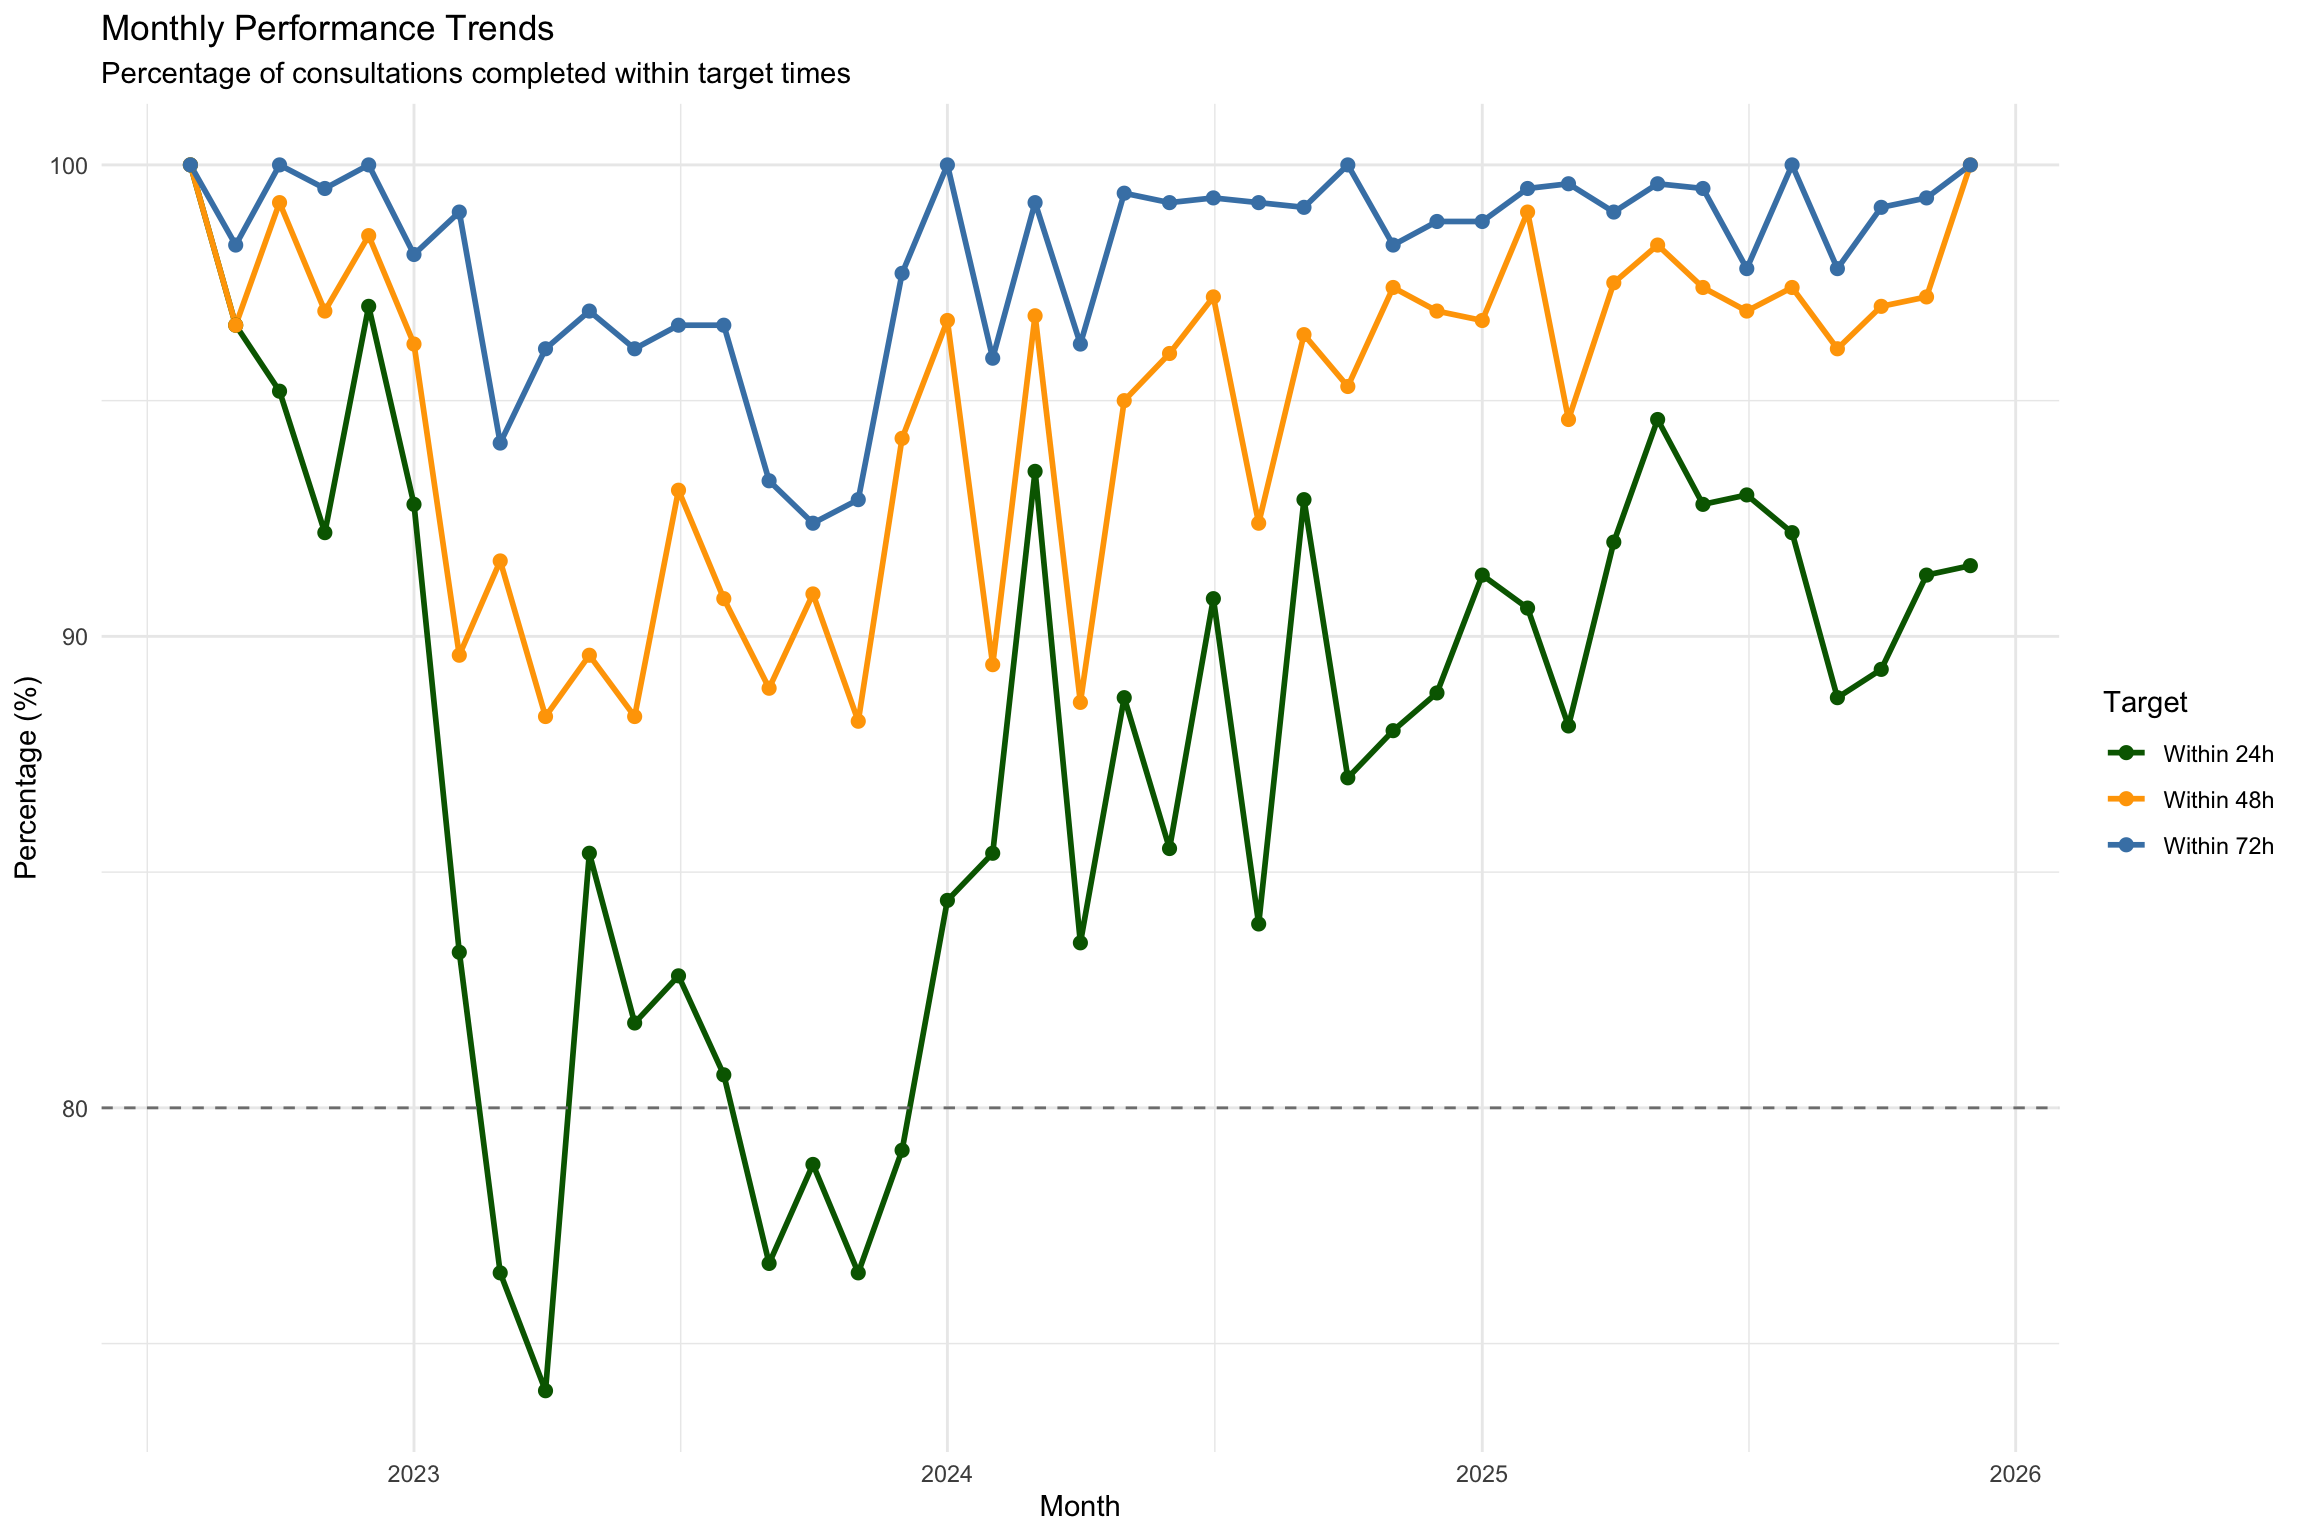
Track performance over time to identify improvements or degradation:
| Month | Total | Within_24h | Within_48h | Within_72h | Pct_24h | Pct_48h | Pct_72h | Median_TAT | Mean_TAT |
|---|---|---|---|---|---|---|---|---|---|
| 2022-08-01 | 27 | 27 | 27 | 27 | 100.0 | 100.0 | 100.0 | 13.9 | 11.2 |
| 2022-09-01 | 59 | 57 | 57 | 58 | 96.6 | 96.6 | 98.3 | 14.2 | 13.0 |
| 2022-10-01 | 124 | 118 | 123 | 124 | 95.2 | 99.2 | 100.0 | 5.1 | 9.5 |
| 2022-11-01 | 192 | 177 | 186 | 191 | 92.2 | 96.9 | 99.5 | 14.2 | 13.0 |
| 2022-12-01 | 197 | 191 | 194 | 197 | 97.0 | 98.5 | 100.0 | 5.1 | 8.5 |
| 2023-01-01 | 208 | 193 | 200 | 204 | 92.8 | 96.2 | 98.1 | 5.1 | 10.3 |
| 2023-02-01 | 96 | 80 | 86 | 95 | 83.3 | 89.6 | 99.0 | 4.0 | 13.8 |
| 2023-03-01 | 119 | 91 | 109 | 112 | 76.5 | 91.6 | 94.1 | 4.7 | 16.4 |
| 2023-04-01 | 77 | 57 | 68 | 74 | 74.0 | 88.3 | 96.1 | 5.1 | 17.0 |
| 2023-05-01 | 96 | 82 | 86 | 93 | 85.4 | 89.6 | 96.9 | 5.3 | 14.4 |
| 2023-06-01 | 77 | 63 | 68 | 74 | 81.8 | 88.3 | 96.1 | 4.7 | 15.8 |
| 2023-07-01 | 87 | 72 | 81 | 84 | 82.8 | 93.1 | 96.6 | 3.7 | 12.8 |
| 2023-08-01 | 119 | 96 | 108 | 115 | 80.7 | 90.8 | 96.6 | 5.1 | 14.8 |
| 2023-09-01 | 90 | 69 | 80 | 84 | 76.7 | 88.9 | 93.3 | 5.1 | 16.4 |
| 2023-10-01 | 66 | 52 | 60 | 61 | 78.8 | 90.9 | 92.4 | 2.9 | 14.8 |
| 2023-11-01 | 85 | 65 | 75 | 79 | 76.5 | 88.2 | 92.9 | 3.5 | 17.1 |
| 2023-12-01 | 86 | 68 | 81 | 84 | 79.1 | 94.2 | 97.7 | 4.8 | 13.1 |
| 2024-01-01 | 90 | 76 | 87 | 90 | 84.4 | 96.7 | 100.0 | 3.9 | 11.2 |
| 2024-02-01 | 123 | 105 | 110 | 118 | 85.4 | 89.4 | 95.9 | 3.9 | 14.8 |
| 2024-03-01 | 124 | 116 | 120 | 123 | 93.5 | 96.8 | 99.2 | 3.4 | 8.2 |
| 2024-04-01 | 79 | 66 | 70 | 76 | 83.5 | 88.6 | 96.2 | 3.4 | 13.4 |
| 2024-05-01 | 159 | 141 | 151 | 158 | 88.7 | 95.0 | 99.4 | 2.7 | 9.5 |
| 2024-06-01 | 124 | 106 | 119 | 123 | 85.5 | 96.0 | 99.2 | 2.9 | 11.0 |
| 2024-07-01 | 142 | 129 | 138 | 141 | 90.8 | 97.2 | 99.3 | 1.9 | 8.1 |
| 2024-08-01 | 118 | 99 | 109 | 117 | 83.9 | 92.4 | 99.2 | 4.3 | 12.5 |
| 2024-09-01 | 112 | 104 | 108 | 111 | 92.9 | 96.4 | 99.1 | 3.0 | 9.7 |
| 2024-10-01 | 169 | 147 | 161 | 169 | 87.0 | 95.3 | 100.0 | 2.3 | 9.6 |
| 2024-11-01 | 117 | 103 | 114 | 115 | 88.0 | 97.4 | 98.3 | 3.0 | 10.2 |
| 2024-12-01 | 161 | 143 | 156 | 159 | 88.8 | 96.9 | 98.8 | 2.7 | 10.2 |
| 2025-01-01 | 241 | 220 | 233 | 238 | 91.3 | 96.7 | 98.8 | 2.0 | 8.1 |
| 2025-02-01 | 203 | 184 | 201 | 202 | 90.6 | 99.0 | 99.5 | 2.4 | 7.4 |
| 2025-03-01 | 261 | 230 | 247 | 260 | 88.1 | 94.6 | 99.6 | 2.9 | 9.9 |
| 2025-04-01 | 199 | 183 | 194 | 197 | 92.0 | 97.5 | 99.0 | 1.8 | 7.8 |
| 2025-05-01 | 240 | 227 | 236 | 239 | 94.6 | 98.3 | 99.6 | 1.9 | 6.0 |
| 2025-06-01 | 195 | 181 | 190 | 194 | 92.8 | 97.4 | 99.5 | 2.4 | 7.4 |
| 2025-07-01 | 228 | 212 | 221 | 223 | 93.0 | 96.9 | 97.8 | 2.4 | 8.4 |
| 2025-08-01 | 192 | 177 | 187 | 192 | 92.2 | 97.4 | 100.0 | 2.7 | 7.9 |
| 2025-09-01 | 231 | 205 | 222 | 226 | 88.7 | 96.1 | 97.8 | 2.5 | 10.0 |
| 2025-10-01 | 234 | 209 | 227 | 232 | 89.3 | 97.0 | 99.1 | 2.6 | 9.0 |
| 2025-11-01 | 288 | 263 | 280 | 286 | 91.3 | 97.2 | 99.3 | 3.0 | 8.4 |
| 2025-12-01 | 47 | 43 | 47 | 47 | 91.5 | 100.0 | 100.0 | 1.8 | 5.3 |
12.2.1 Performance Trend Visualization
12.3 Control Charts (Statistical Process Control)
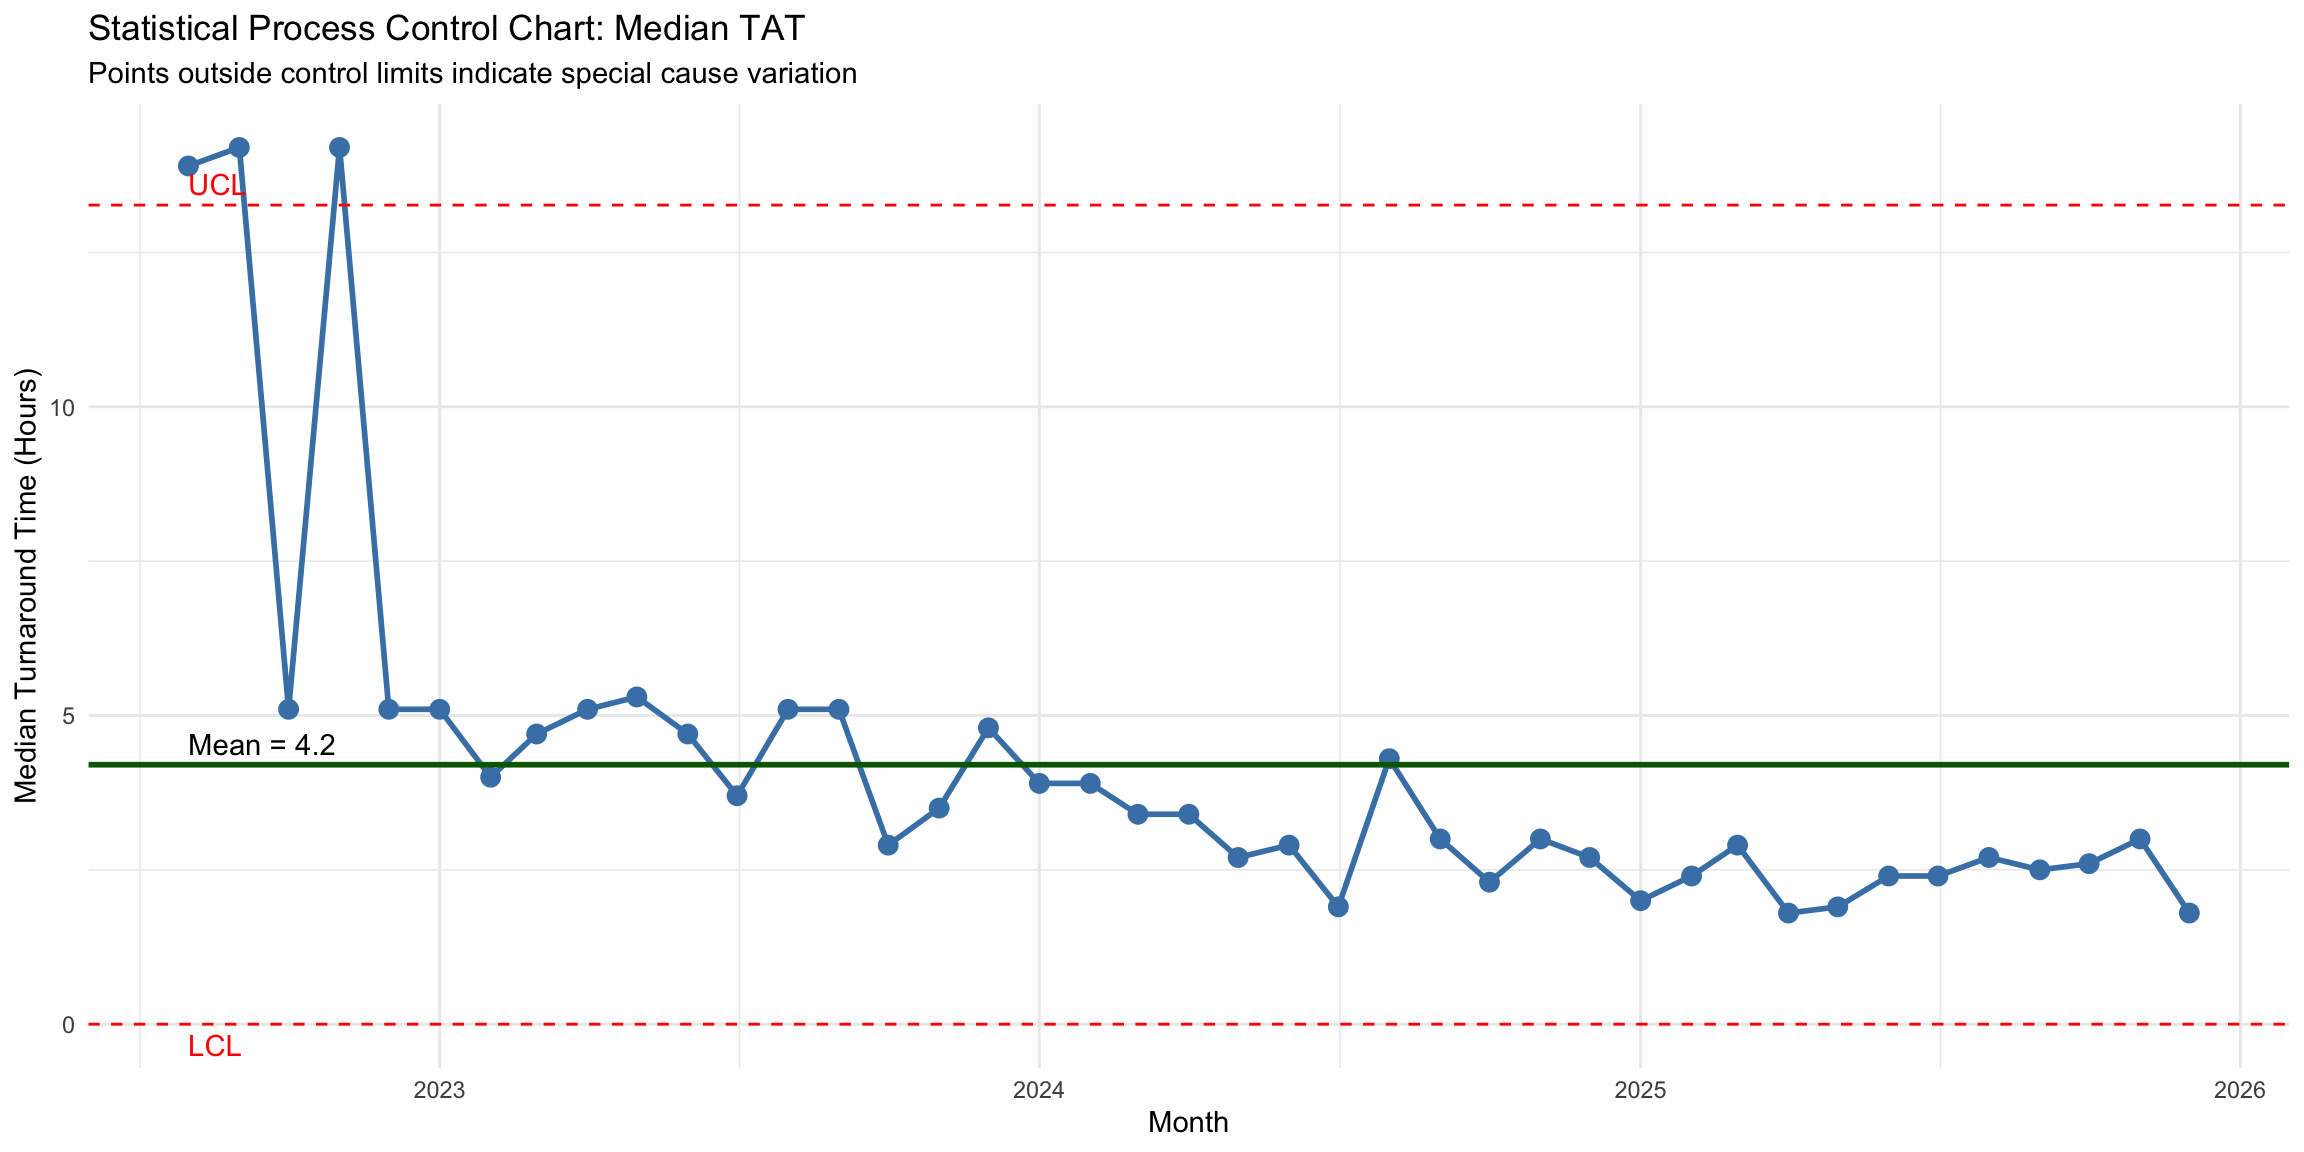
Statistical Process Control (SPC) charts monitor whether a process is operating within expected variation or whether special-cause events have shifted performance (Westgard and Westgard 2016). The chart below applies a Shewhart I-chart to monthly median TAT values. Control limits (mean ± 3 SD of the monthly medians) distinguish common-cause variation from signals warranting investigation. Points outside the limits suggest months where an unusual event (staffing change, case surge, holiday period) may have affected consultation turnaround.
Methodological note: Because individual-case TAT is right-skewed, we chart the monthly medians rather than individual observations, which produces a more symmetric distribution suitable for symmetric control limits. The lower control limit is bounded at zero. Control limits are computed as mean ± 3 SD of the monthly medians, which is a simplification of the traditional I-chart approach that uses the moving range estimator (MR̄/d₂ with d₂ = 1.128). For monthly medians — which are already aggregated and relatively well-behaved — the SD-based approach is a reasonable approximation; the assumption diagnostics below verify whether the conditions for this approach are met.
12.3.1 Median TAT Control Chart
12.3.2 Control Chart Assumption Checks
Shewhart control charts assume that the plotted statistic (here, monthly median TAT) is approximately normally distributed and that consecutive observations are independent. We verify both assumptions below.
| Assumption | Statistic | P-value | Interpretation |
|---|---|---|---|
| Normality of monthly medians (Shapiro-Wilk) | 0.6248 | 5.22e-09 | Monthly medians deviate from normality -- interpret 3-sigma limits with caution (consider percentile-based limits) |
| Independence (Durbin-Watson) | 1.407 | 0.0166 | Significant autocorrelation detected -- consecutive months are correlated, which may inflate out-of-control signals |
| Randomness (Runs test) | N/A (lawstat package needed) | N/A | Not tested |
12.3.3 Identifying Out-of-Control Points
| Month | Median_TAT | Mean_TAT | Total |
|---|---|---|---|
| 2022-08-01 | 13.9 | 11.2 | 27 |
| 2022-09-01 | 14.2 | 13.0 | 59 |
| 2022-11-01 | 14.2 | 13.0 | 192 |
12.3.4 Nelson Rules (Additional SPC Signals)
Beyond the basic 3-sigma rule, Nelson rules detect subtler patterns of non-random behavior. The most commonly applied supplementary rules are checked below.
| Rule | Description | Months Flagged |
|---|---|---|
| Rule 1 | Point beyond 3-sigma control limits | 2022-08, 2022-09, 2022-11 |
| Rule 2 | 9+ consecutive points on same side of center line | 2024-09, 2024-10, 2024-11, 2024-12, 2025-01, 2025-02, 2025-03, 2025-04, 2025-05, 2025-06, 2025-07, 2025-08, 2025-09, 2025-10, 2025-11, 2025-12 |
| Rule 3 | 6+ consecutive points steadily increasing or decreasing | None |
| Rule 5 | 2 of 3 consecutive points beyond 2-sigma (same side) | 2022-08, 2022-09, 2022-10, 2022-11 |
12.4 Outlier Cases Analysis
Identify and analyze cases with exceptionally long turnaround times. Note that extreme outliers (> 99th percentile of the raw distribution AND > 30 days) were already excluded during data processing (see process_data.qmd). The threshold below is the 99th percentile of the cleaned dataset:
| Case_ID | Asker | Responder | Start_Date | Completion_Date | Turnaround_Time_Hours | Turnaround_Time_Days |
|---|---|---|---|---|---|---|
| 45127-23 | P16 | P6 | 2023-11-28 | 2023-12-02 | 103.48 | 4.31 |
| 32836-22 | P12 | P5 | 2022-09-10 | 2022-09-14 | 103.10 | 4.30 |
| 46474-25 | P13 | P8 | 2025-09-05 | 2025-09-09 | 102.40 | 4.27 |
| 30790-25 | P25 | P17 | 2025-06-16 | 2025-06-20 | 101.89 | 4.25 |
| 36838-24 | P22 | P8 | 2024-07-22 | 2024-07-26 | 101.80 | 4.24 |
| A_7309-23 | P3 | P6 | 2023-06-05 | 2023-06-09 | 99.32 | 4.14 |
| 10156-23 | P11 | P8 | 2023-03-24 | 2023-03-28 | 99.27 | 4.14 |
| A_11293-23 | P19 | P17 | 2023-09-01 | 2023-09-05 | 97.86 | 4.08 |
| A_11293-23 | P19 | P33 | 2023-09-01 | 2023-09-05 | 97.86 | 4.08 |
| 15118-23 | P6 | P2 | 2023-05-02 | 2023-05-06 | 97.52 | 4.06 |
| 4450-24 | P8 | P17 | 2024-02-05 | 2024-02-09 | 97.14 | 4.05 |
| A_1741-23 | P3 | P17 | 2023-02-08 | 2023-02-12 | 97.14 | 4.05 |
| 14044-23 | P19 | P5 | 2023-04-20 | 2023-04-24 | 97.08 | 4.04 |
| 38263-22 | P11 | P6 | 2022-11-03 | 2022-11-07 | 96.89 | 4.04 |
| 47387-24 | P25 | P17 | 2024-09-14 | 2024-09-18 | 96.59 | 4.02 |
| 64536-24 | P16 | P9 | 2024-12-12 | 2024-12-16 | 96.26 | 4.01 |
| 34633-25 | P22 | P8 | 2025-07-03 | 2025-07-07 | 96.24 | 4.01 |
| 2871-23 | P6 | P2 | 2023-01-31 | 2023-02-04 | 96.15 | 4.01 |
| 12445-23 | P11 | P33 | 2023-04-08 | 2023-04-12 | 96.11 | 4.00 |
| 16652-23 | P2 | P1 | 2023-05-11 | 2023-05-15 | 95.78 | 3.99 |
12.4.1 Outlier Frequency by Pathologist
Which pathologists are involved in the most outlier cases?
| Pathologist | As_Asker | As_Responder | Total |
|---|---|---|---|
| P8 | 10 | 9 | 19 |
| P17 | 0 | 18 | 18 |
| P6 | 2 | 7 | 9 |
| P2 | 6 | 2 | 8 |
| P22 | 6 | 0 | 6 |
| P18 | 4 | 1 | 5 |
| P33 | 0 | 5 | 5 |
| P11 | 4 | 0 | 4 |
| P10 | 3 | 1 | 4 |
| P16 | 3 | 1 | 4 |
12.5 Performance by Responder
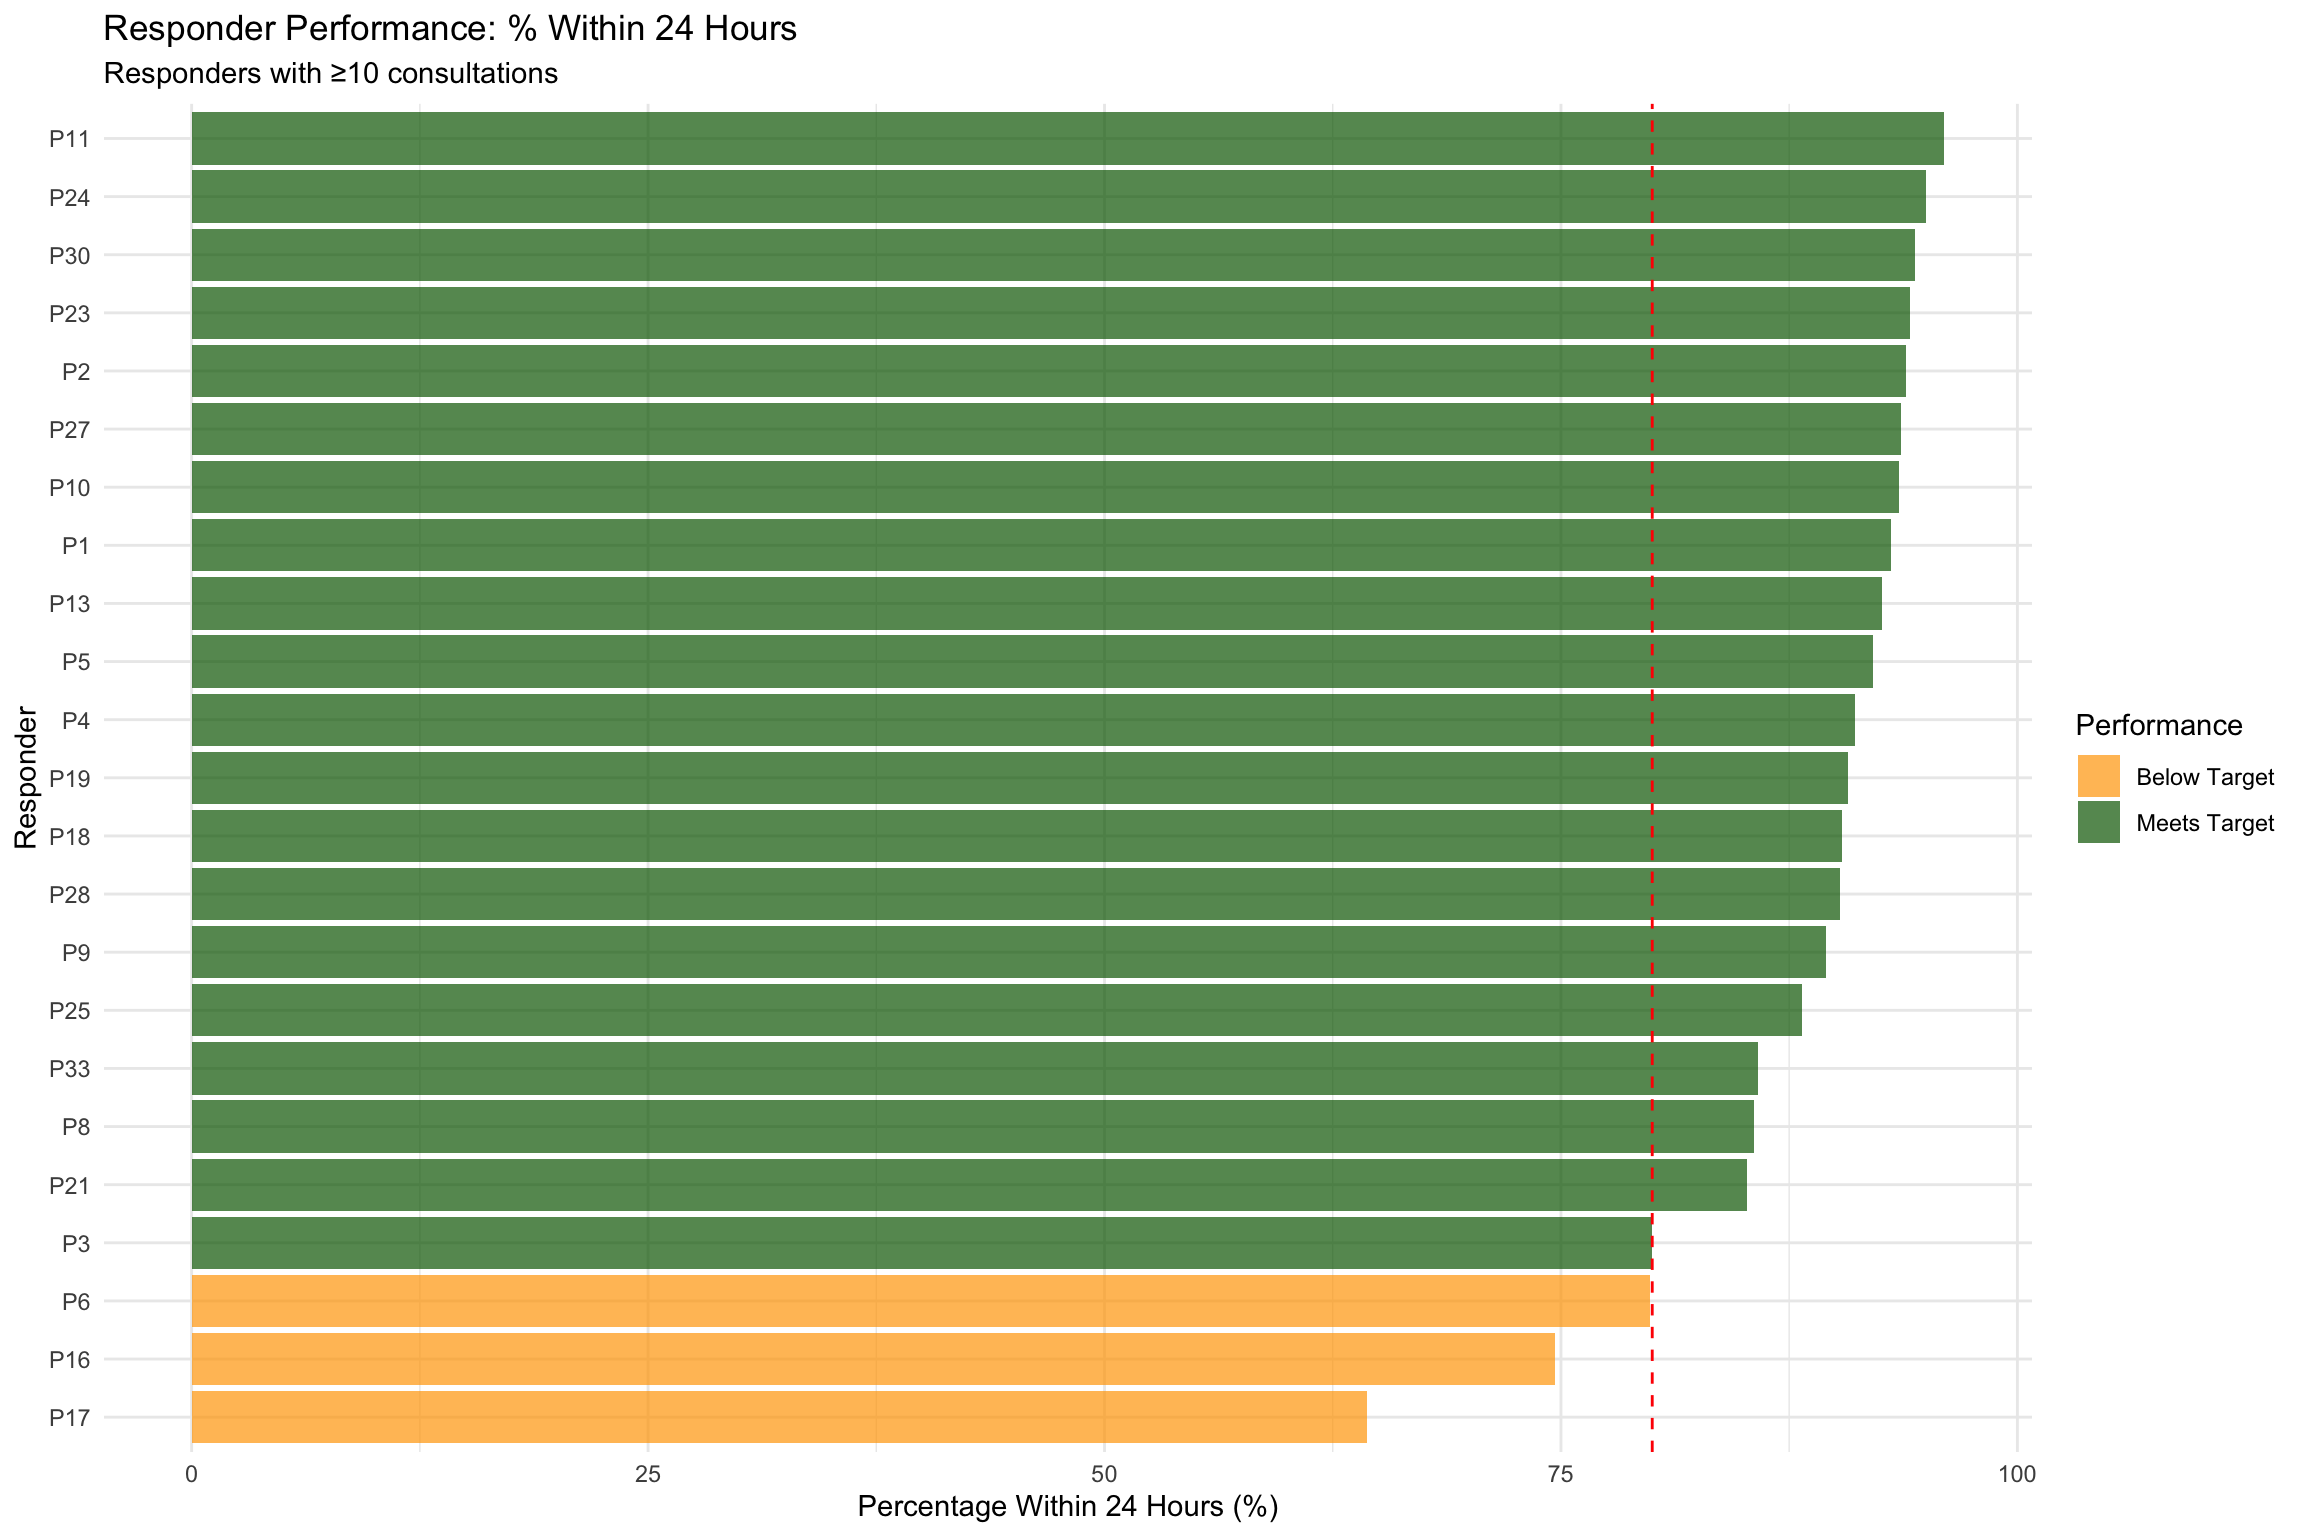
Detailed performance metrics for each responder:
| Responder | N_Consultations | N_Valid_TAT | Median_TAT | Mean_TAT | Within_24h | Within_48h | Pct_24h | Pct_48h |
|---|---|---|---|---|---|---|---|---|
| P5 | 751 | 751 | 2.0 | 7.6 | 692 | 729 | 92.1 | 97.1 |
| P9 | 696 | 696 | 5.1 | 10.1 | 623 | 668 | 89.5 | 96.0 |
| P2 | 684 | 684 | 2.1 | 6.5 | 642 | 668 | 93.9 | 97.7 |
| P11 | 522 | 522 | 1.7 | 5.4 | 501 | 516 | 96.0 | 98.9 |
| P23 | 407 | 407 | 3.0 | 7.1 | 383 | 400 | 94.1 | 98.3 |
| P21 | 399 | 399 | 3.7 | 12.3 | 340 | 382 | 85.2 | 95.7 |
| P17 | 362 | 362 | 20.3 | 24.5 | 233 | 304 | 64.4 | 84.0 |
| P8 | 348 | 348 | 3.4 | 11.7 | 298 | 323 | 85.6 | 92.8 |
| P33 | 261 | 261 | 17.5 | 19.2 | 224 | 241 | 85.8 | 92.3 |
| P6 | 254 | 254 | 14.2 | 17.9 | 203 | 226 | 79.9 | 89.0 |
| P19 | 227 | 227 | 2.6 | 7.9 | 206 | 221 | 90.7 | 97.4 |
| P10 | 216 | 216 | 1.4 | 6.8 | 202 | 211 | 93.5 | 97.7 |
| P28 | 124 | 124 | 3.0 | 9.8 | 112 | 120 | 90.3 | 96.8 |
| P24 | 120 | 120 | 1.3 | 5.1 | 114 | 118 | 95.0 | 98.3 |
| P27 | 94 | 94 | 1.1 | 4.7 | 88 | 93 | 93.6 | 98.9 |
| P18 | 83 | 83 | 4.0 | 8.5 | 75 | 81 | 90.4 | 97.6 |
| P4 | 79 | 79 | 8.9 | 12.1 | 72 | 76 | 91.1 | 96.2 |
| P16 | 75 | 75 | 18.1 | 18.5 | 56 | 68 | 74.7 | 90.7 |
| P13 | 68 | 68 | 1.8 | 7.3 | 63 | 65 | 92.6 | 95.6 |
| P1 | 29 | 29 | 13.9 | 15.0 | 27 | 28 | 93.1 | 96.6 |
| P30 | 18 | 18 | 3.4 | 6.9 | 17 | 18 | 94.4 | 100.0 |
| P25 | 17 | 17 | 6.1 | 11.2 | 15 | 17 | 88.2 | 100.0 |
| P3 | 15 | 15 | 5.5 | 13.2 | 12 | 14 | 80.0 | 93.3 |
| P14 | 8 | 8 | 0.5 | 0.5 | 8 | 8 | 100.0 | 100.0 |
| P32 | 8 | 8 | 1.4 | 14.1 | 7 | 7 | 87.5 | 87.5 |
| P26 | 6 | 6 | 9.8 | 22.9 | 4 | 4 | 66.7 | 66.7 |
| P22 | 3 | 3 | 0.5 | 0.5 | 3 | 3 | 100.0 | 100.0 |
| P7 | 3 | 3 | 7.2 | 7.2 | 3 | 3 | 100.0 | 100.0 |
| P20 | 2 | 2 | 12.7 | 12.7 | 1 | 2 | 50.0 | 100.0 |
| P12 | 1 | 1 | 1.6 | 1.6 | 1 | 1 | 100.0 | 100.0 |
| P15 | 1 | 1 | 1.6 | 1.6 | 1 | 1 | 100.0 | 100.0 |
| P29 | 1 | 1 | 0.1 | 0.1 | 1 | 1 | 100.0 | 100.0 |
12.5.1 Responder Performance Comparison
12.6 Consultation Success Rate
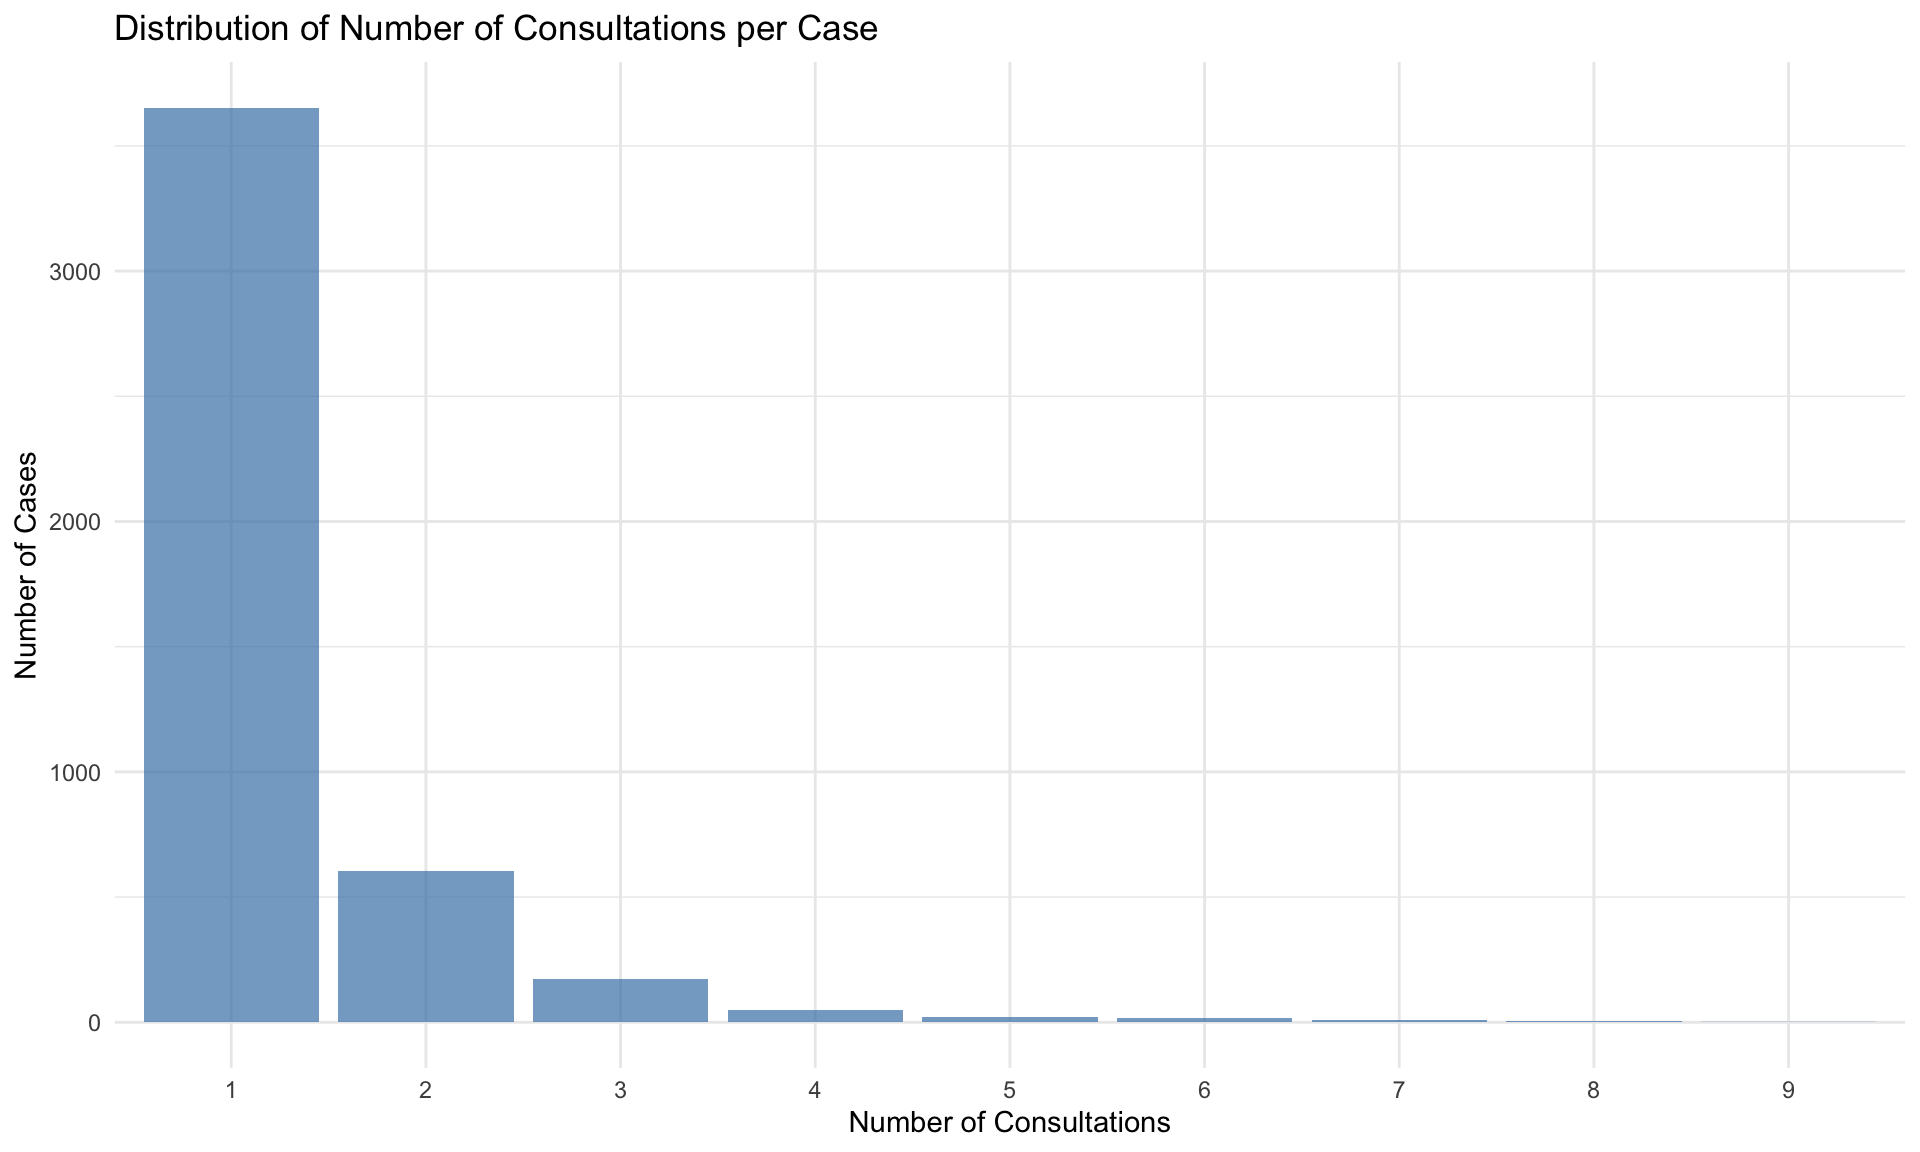
If follow-up consultations indicate issues with initial consultation:
| Metric | Value |
|---|---|
| Single Consultation Cases | 3653 |
| Multiple Consultation Cases | 879 |
| Success Rate (Single Consultation) | 80.6% |
12.6.1 Distribution of Consultation Counts per Case
12.7 Quality Improvement Opportunities
Quality improvement in anatomic pathology requires systematic identification of outliers and process defects (Nakhleh et al. 2016). The metrics below highlight cases and patterns that may benefit from targeted review.
12.7.1 Cases Requiring Immediate Attention
Cases that exceed acceptable thresholds:
No cases exceed the attention threshold.12.7.2 Performance Improvement Recommendations
| Category | Recommendation |
|---|---|
| Best Practices | 20 responder(s) exceed 80% within 24h. Study their practices for replication. |
12.8 CAP Q-Probes Benchmark Comparison
Comparing this department’s performance against published benchmarks from the College of American Pathologists (CAP) Q-Probes studies and other multi-institutional data provides external context for interpreting the quality metrics above.
| Metric | This Department (95% CI) | CAP Q-Probes Benchmark | Source |
|---|---|---|---|
| Median TAT (days) | 0.13 [0.12, 0.13] | 2.72 (10th-90th: 1.22-6.23) | Volmar et al. 2015, 56 institutions |
| % Within 24 hours | 88.9% [88%, 89.7%] | --- | --- |
| % Within 48 hours (2 business days) | 95.5% [95%, 96%] | >=90% target (CPT 88305) | CAP routine surgical pathology target |
| Outlier Cases (>99th percentile) | 58 | --- | --- |
NoteInterpretation
The CAP Q-Probes data from 56 institutions (Volmar et al. 2015) established a median TAT of 2.72 days (10th–90th percentile: 1.22–6.23 days) for complex surgical pathology specimens (CPT 88307/88309). The standard target for routine specimens is ≥90% completion within 2 business days. Note that these benchmarks apply to primary specimen sign-out, not intradepartmental consultation specifically — no widely accepted TAT benchmarks exist for intradepartmental consultations. However, the CAP routine target provides a reasonable upper-bound expectation for consultation turnaround (Sharma et al. 2025).
12.9 Executive Summary KPI Dashboard
| KPI | Value | Target |
|---|---|---|
| Total Consultations | 5882 | — |
| Unique Cases | 4532 | — |
| Overall Median TAT (hours) | 3 | ≤24 |
| Overall Mean TAT (hours) | 10.3 | ≤36 |
| % Within 24 hours | 88.9% | ≥80% |
| % Within 48 hours | 95.5% | ≥90% |
| % Within 72 hours | 98.5% | ≥95% |
| Cases >1 week | 0 | 0 |
| Outlier Cases (>99th percentile) | 58 | ≤1% |