[1] TRUE3 Data Processing
This section describes the steps taken to process the raw data into a clean dataset for analysis.
3.1 Overview
The data processing pipeline is implemented in R/process_data.R. It performs the following operations:
- Data Loading: Reads data from:
Paylasilan Vakalar(Primary Source for Asker/Assignment)vaka_paylasildi(Primary Source for Start Time)internal_consultation(Primary Source for Responder/Completion & Backbone)
- Cleaning:
- Standardizes
Case IDby removing suffixes (e.g.,;[11]). - Parses dates into
POSIXctformat (UTC) from various Excel formats. - Normalizes names to handle Turkish character encoding issues.
- Standardizes
- Logic Implementation (Priority Coalescence):
- Asker: Paylasilan > Internal > Vaka.
- Start Time: Vaka > Internal.
- Responder/Completion: Internal (Sole Source).
- Filtering:
- Self-consultations (Asker == Responder).
- Incomplete records (Missing Responder).
- Output: The processed dataset is saved as
data/processed/consultation_data.rds.
3.2 Execution
The processing script can be executed as follows:
source("R/process_data.R")3.3 Key Variables
The final dataset contains the following key variables:
Case_ID: Unique identifier for the case.Asker: The pathologist requesting the consultation.Responder: The pathologist providing the consultation.Start_Time: Timestamp when the consultation was initiated.Completion_Time: Timestamp when the consultation was completed.Turnaround_Time_Minutes: Duration of this specific consultation in minutes (calendar time).Turnaround_Time_Hours: Duration of this specific consultation in hours (calendar time).Turnaround_Time_Days: Duration of this specific consultation in days (calendar time).Business_TAT_Hours: Net business turnaround time in hours, excluding weekends, Turkish public holidays, and non-business hours (08:00–18:00). This provides a more operationally meaningful measure of response time by counting only the hours during which pathologists are expected to be working.Min_TAT_Minutes: Minimum TAT (first response time) for the case in minutes.Min_TAT_Hours: Minimum TAT (first response time) for the case in hours.Min_TAT_Days: Minimum TAT (first response time) for the case in days.Overall_TAT_Minutes: Overall TAT (final completion time) for the case in minutes.Overall_TAT_Hours: Overall TAT (final completion time) for the case in hours.Overall_TAT_Days: Overall TAT (final completion time) for the case in days.Is_Imputed_Start: Boolean flag indicating if start time was imputed.Pair_Sequence: Order of the consultation within each Asker-Responder pair for the case.First_Response_Time: Time to the first response for the case (same as Min_TAT_Hours).Overall_Response_Time: Time to the final response for the case (same as Overall_TAT_Hours).Is_Multi_Consultant_Case: Boolean flag for cases with multiple distinct consultants.
3.4 Data Quality Assessment
This section provides a comprehensive overview of the data quality and processing steps.
3.4.1 Time Period Coverage
| Metric | Value |
|---|---|
| Start Date | 2022-08-22 |
| End Date | 2025-12-04 |
| Duration (Days) | 1200 |
| Duration (Months) | 39.4 |
3.4.2 Sample Size Summary
| Metric | Value |
|---|---|
| Total Consultation Records | 5,882 |
| Unique Cases | 4,532 |
| Unique Askers | 33 |
| Unique Responders | 32 |
| Unique Pathologists (Total) | 36 |
| Consultations per Case (Mean) | 1.30 |
| Consultations per Case (Median) | 1 |
3.4.3 Data Completeness
| Variable | Missing Count | Missing % |
|---|---|---|
| Case_ID | 0 | 0.00 |
| Asker | 4 | 0.07 |
| Responder | 0 | 0.00 |
| Start_Time | 0 | 0.00 |
| Completion_Time | 0 | 0.00 |
| Turnaround_Time_Minutes | 0 | 0.00 |
| Turnaround_Time_Hours | 0 | 0.00 |
| Turnaround_Time_Days | 0 | 0.00 |
| Business_TAT_Hours | 0 | 0.00 |
| Min_TAT_Hours | 0 | 0.00 |
| Overall_TAT_Hours | 0 | 0.00 |
3.4.4 Data Processing Flow Diagram
This diagram shows the number of records at each processing step:
Data Processing Steps:
- Raw Data Loading
- Consultation initiation records (
vaka_paylasildi) - Consultation completion records (
kalite_indikatoru_eklendi) - Consultant assignment records (
Paylasilan Vakalar)
- Consultation initiation records (
- Data Cleaning
- Case ID standardization (removal of suffixes)
- Date/time parsing and validation
- Name normalization and mapping
- Data Integration
- Join initiation and assignment data (identify Asker)
- Join with completion data (identify Responder)
- Quality Filters Applied
- Remove self-consultations (Asker = Responder)
- Remove records with negative turnaround times
- Remove excluded pathologists
- Remove records with missing key fields
- Derived Metrics
- Calendar TAT:
Completion_Time - Start_Timein minutes, hours, and days - Net Business TAT (
Business_TAT_Hours): Elapsed business hours only, excluding weekends (Saturday and Sunday), Turkish fixed public holidays (New Year’s Day, Apr 23, May 1, May 19, Jul 15, Aug 30, Oct 29), and hours outside the 08:00–18:00 business window. This metric reflects the actual working time available for a pathologist to respond, providing a fairer basis for performance comparison than raw calendar time.
- Calendar TAT:
- Anonymization
- Assign codes to pathologists (P1, P2, …)
3.4.5 Imputation Summary
| Metric | Value |
|---|---|
| Total Records | 5,882 |
| Records with Near-Zero TAT Imputed (TAT < 1 min) | 1,038 |
| Imputation Percentage | 17.65% |
| Imputation Method | Start_Time replaced by Completion_Time minus responder-specific median TAT |
NoteImputation note
Records with TAT < 1 minute (suggesting simultaneous or pre-filled timestamps) had their start time imputed using the responder-specific median TAT from valid cases. Imputed records are flagged with Is_Imputed_Zero_TAT = TRUE. All findings are robust to exclusion of imputed records (sensitivity analysis available upon request).
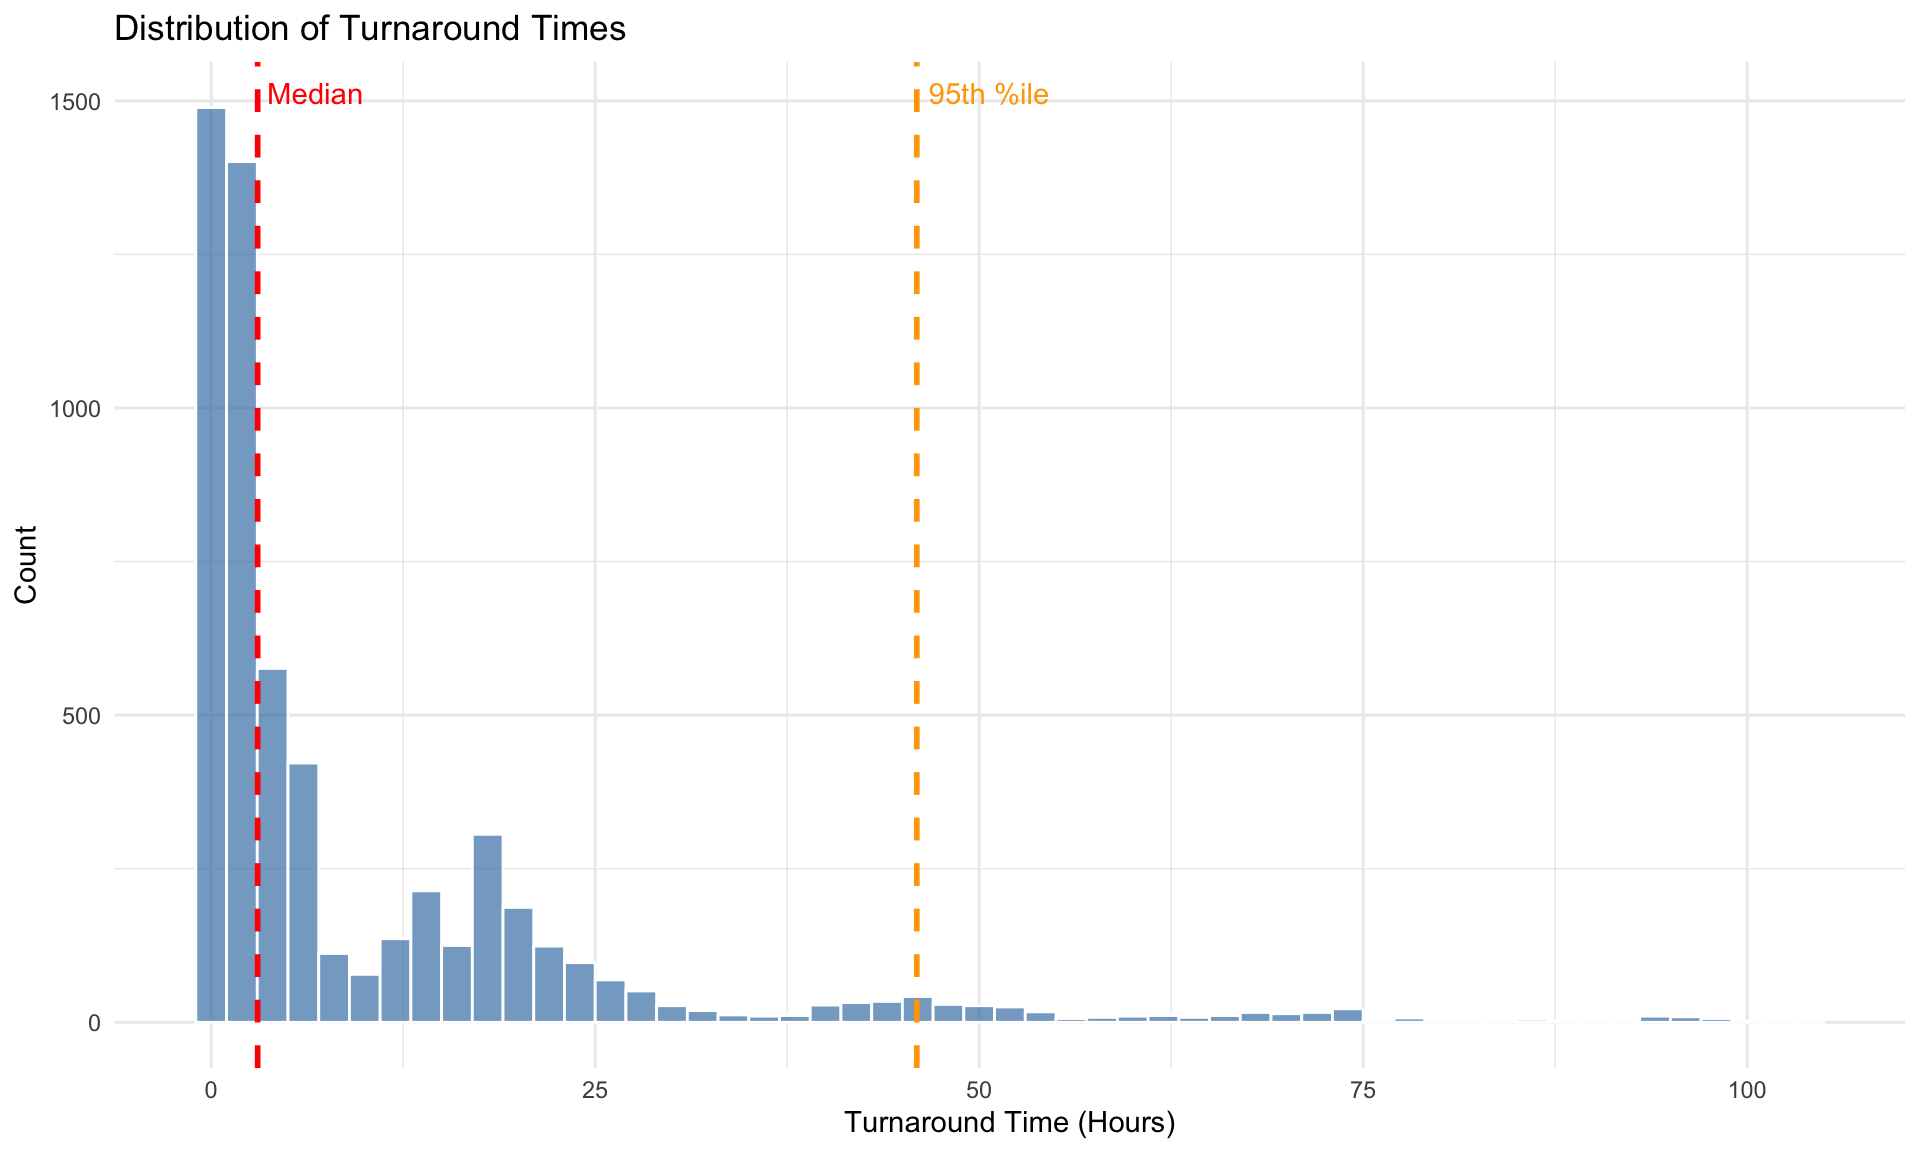
3.4.6 Turnaround Time Distribution Summary
| Statistic | Minutes | Hours | Days |
|---|---|---|---|
| Min | 1.00 | 0.02 | 0.00 |
| 1st Percentile | 1.73 | 0.03 | 0.00 |
| 5th Percentile | 9.80 | 0.16 | 0.01 |
| 10th Percentile | 19.50 | 0.33 | 0.01 |
| 25th Percentile (Q1) | 59.03 | 0.98 | 0.04 |
| Median (Q2) | 181.38 | 3.02 | 0.13 |
| Mean | 618.01 | 10.30 | 0.43 |
| 75th Percentile (Q3) | 885.80 | 14.76 | 0.62 |
| 90th Percentile | 1534.93 | 25.58 | 1.07 |
| 95th Percentile | 2756.14 | 45.94 | 1.91 |
| 99th Percentile | 4542.27 | 75.70 | 3.15 |
| Max | 6208.58 | 103.48 | 4.31 |
| Standard Deviation | 966.12 | 16.10 | 0.67 |
| IQR | 826.77 | 13.78 | 0.57 |
3.4.7 Outlier Detection
Cases with exceptionally long turnaround times (>99th percentile):
| Case_ID | Asker | Responder | Turnaround_Time_Hours | Turnaround_Time_Days |
|---|---|---|---|---|
| 45127-23 | P16 | P6 | 103.47639 | 4.311516 |
| 32836-22 | P12 | P5 | 103.09944 | 4.295810 |
| 46474-25 | P13 | P8 | 102.40083 | 4.266701 |
| 30790-25 | P25 | P17 | 101.88528 | 4.245220 |
| 36838-24 | P22 | P8 | 101.79722 | 4.241551 |
| A_7309-23 | P3 | P6 | 99.32056 | 4.138357 |
| 10156-23 | P11 | P8 | 99.26833 | 4.136181 |
| A_11293-23 | P19 | P17 | 97.85611 | 4.077338 |
| A_11293-23 | P19 | P33 | 97.85611 | 4.077338 |
| 15118-23 | P6 | P2 | 97.52472 | 4.063530 |
3.4.8 Data Quality Visualizations
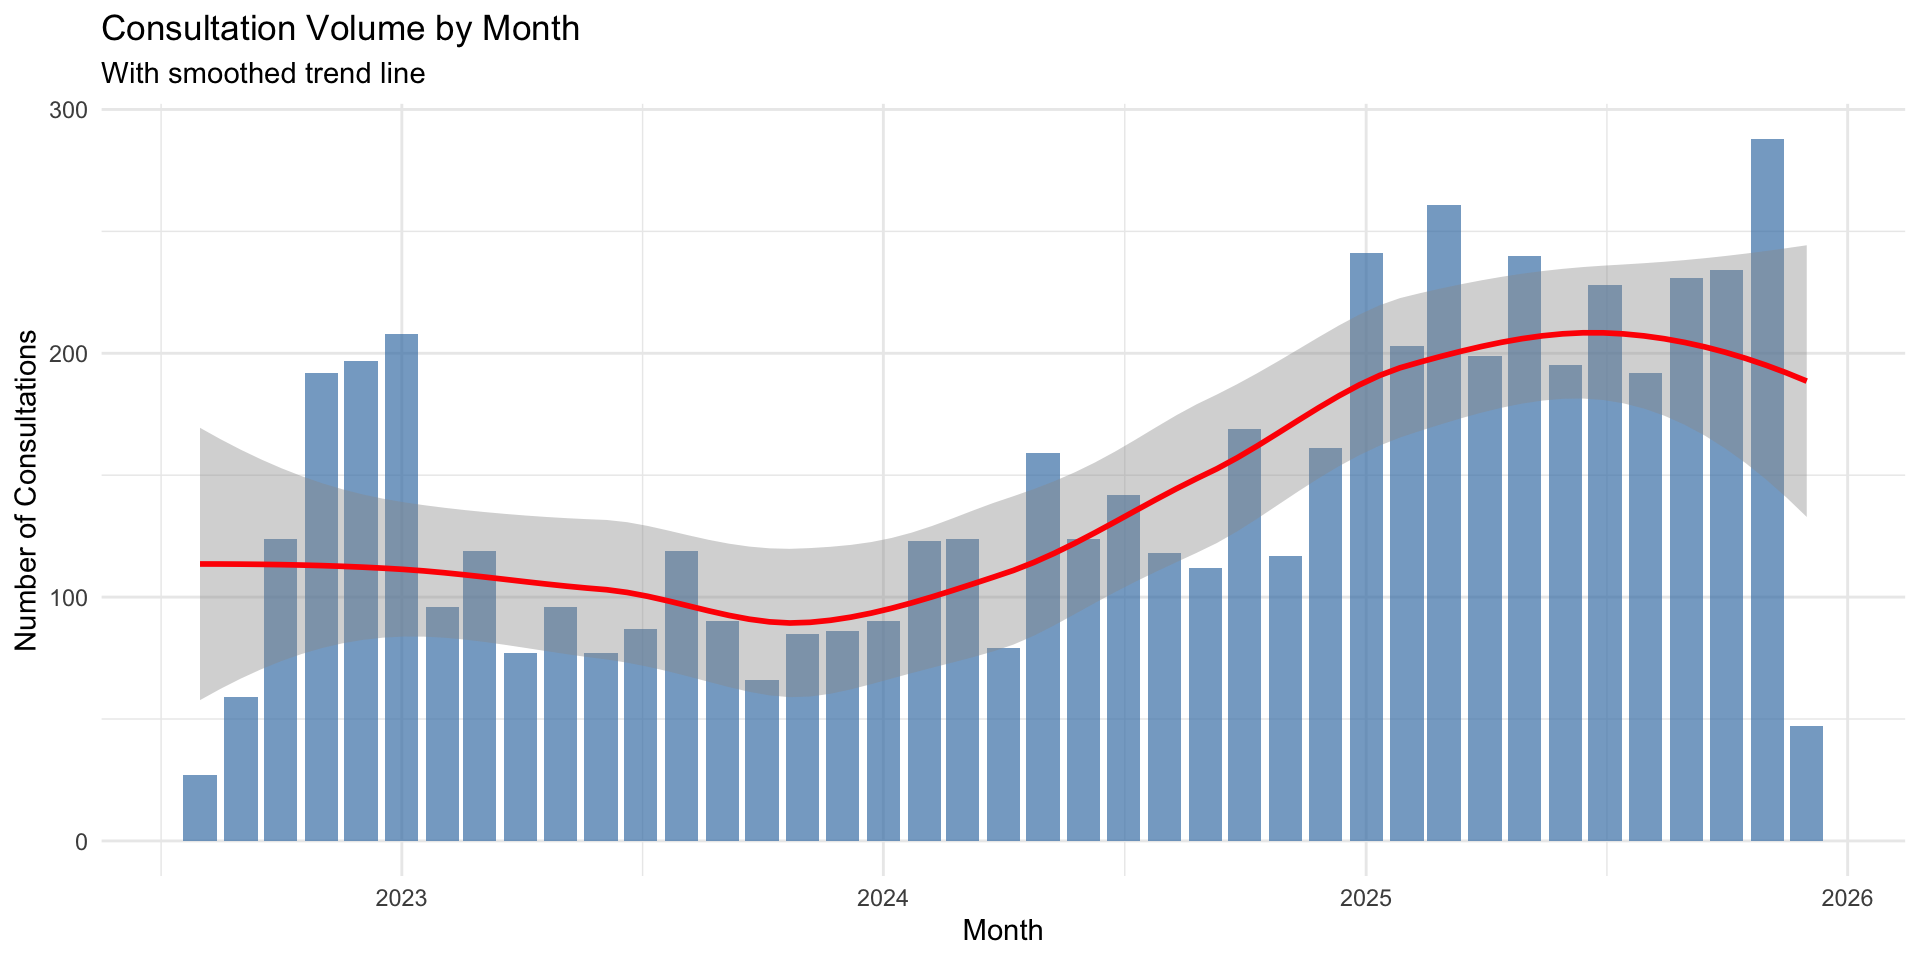
3.4.9 Consultation Activity by Month