[1] TRUE16 Pathologist Clustering Analysis
This chapter explores the practice patterns of pathologists to identify distinct clusters of expertise and workload distribution. We use Hierarchical Clustering based on the distribution of Organs and Consultation Topics associated with each pathologist.
16.1 Feature Engineering
We construct a profile for each pathologist based on: 1. Organ Mix: Proportion of cases from each Organ system. 2. Topic Mix: Proportion of consultation categories (Question Category).
16.2 Hierarchical Clustering & Heatmap
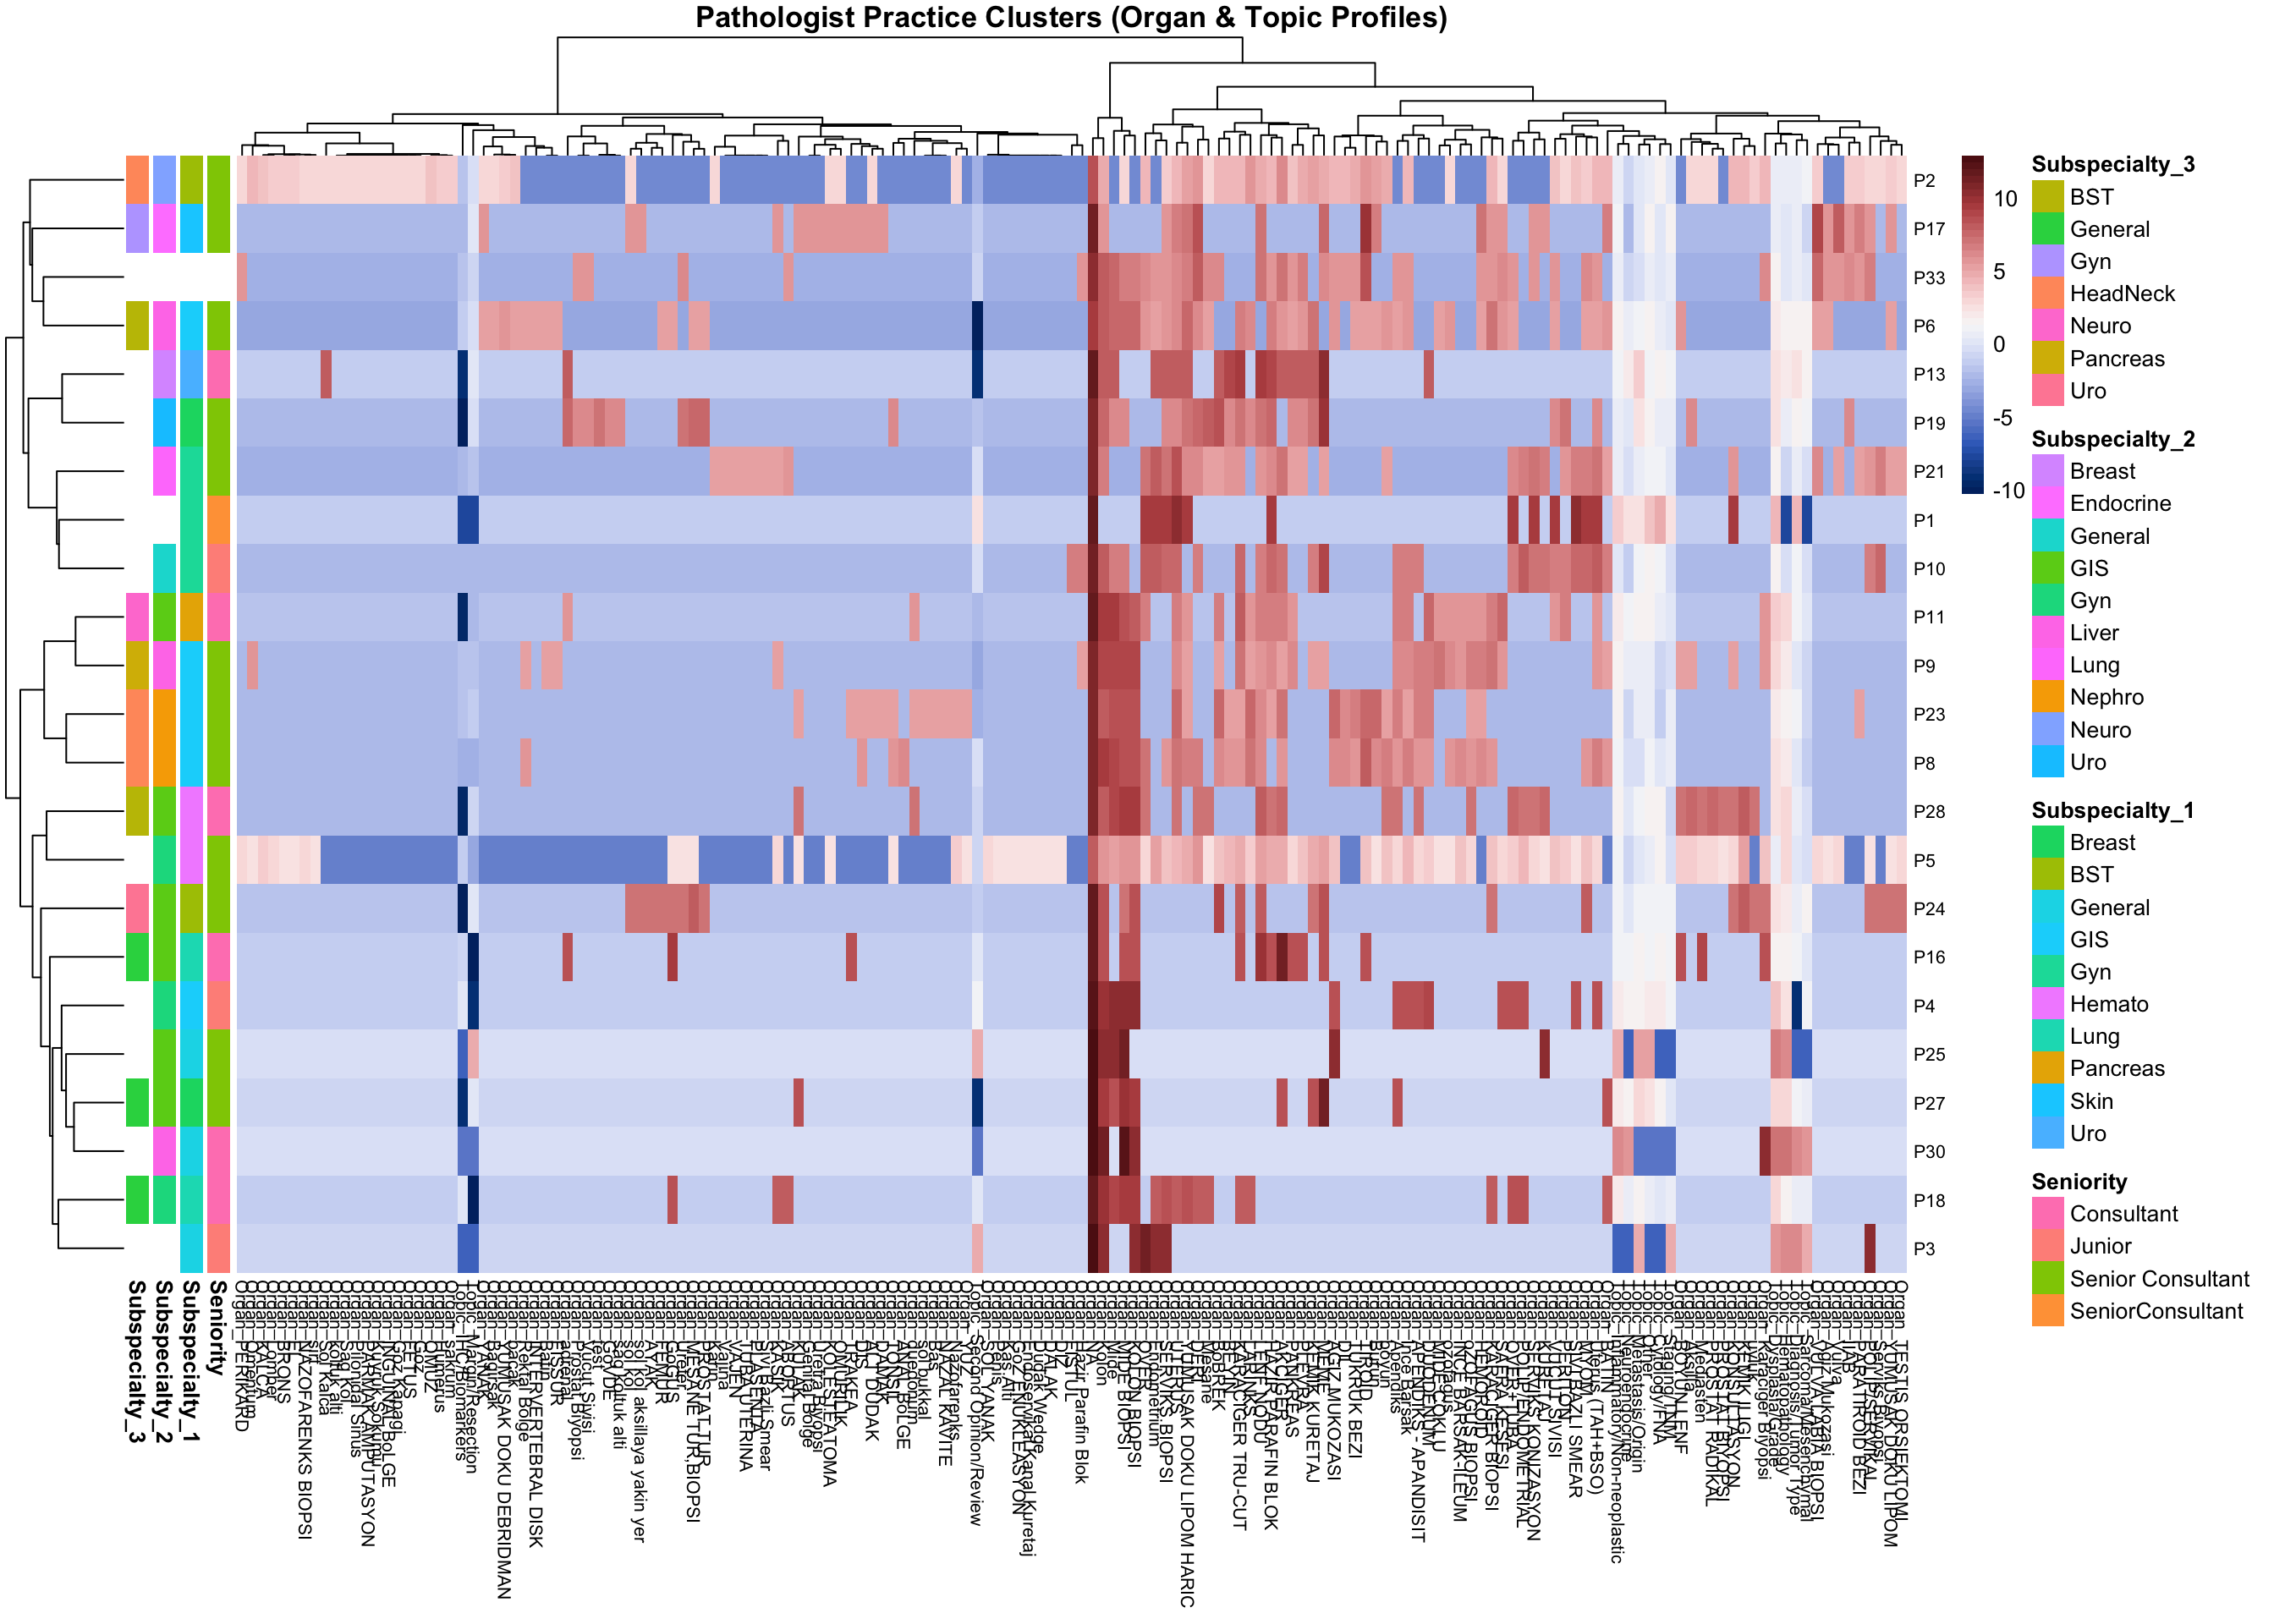
The Heatmap below visualizes the standardized profile of each pathologist. Rows (Pathologists) are grouped by similarity.
- Red: Higher than average proportion for that category.
- Blue: Lower than average proportion.
NoteInterpretation
In this heatmap, each row is a pathologist and each column is an organ or topic category. Red cells mean a pathologist handles a higher-than-average proportion of that category, while blue cells mean lower-than-average. The tree on the left groups pathologists with similar practice profiles together. Pathologists who cluster together tend to work on the same types of cases, even if they are not formally assigned to the same subspecialty.
16.3 Insights
The dendrogram (tree structure on the left) reveals distinct groups of pathologists who handle similar types of work. Comparing these data-driven clusters with the Subspecialty annotation bars (1, 2, and 3) allows us to see:
- Specialist Clusters: Groups dominated by specific organs (e.g., Breast, GIS) likely match their designated subspecialties.
- Generalist/Mixed Clusters: Groups with diverse case mixes, which might represent generalists or fellows/residents (check Seniority).
- Outliers: Pathologists who seemingly work on topics unrelated to their primary subspecialty.
16.4 Tag-Based Feature Matrix
The original clustering above uses only the primary Question_Category. Here we build a richer feature set by exploding multi-label tags from both questions and answers.
| Responder | Cytology/FNA | Diagnosis/Tumor Type | Dysplasia/Grade | Hematopathology | IHC/Biomarkers | Inflammatory/Non-neoplastic | Metastasis/Origin | Neuroendocrine | Sarcoma/Mesenchymal | Second Opinion/Review | Staging/TNM | Margin/Resection |
|---|---|---|---|---|---|---|---|---|---|---|---|---|
| P11 | 0.008 | 0.183 | 0.224 | 0.102 | 0.062 | 0.191 | 0.050 | 0.038 | 0.012 | 0.028 | 0.061 | 0.040 |
| P17 | 0.042 | 0.248 | 0.066 | 0.022 | 0.073 | 0.201 | 0.030 | 0.009 | 0.013 | 0.028 | 0.131 | 0.138 |
| P2 | 0.067 | 0.246 | 0.083 | 0.040 | 0.082 | 0.157 | 0.051 | 0.014 | 0.083 | 0.059 | 0.063 | 0.056 |
| P21 | 0.039 | 0.262 | 0.151 | 0.018 | 0.104 | 0.103 | 0.076 | 0.018 | 0.023 | 0.076 | 0.077 | 0.053 |
| P23 | 0.003 | 0.217 | 0.178 | 0.057 | 0.094 | 0.197 | 0.044 | 0.020 | 0.012 | 0.047 | 0.081 | 0.050 |
| P33 | 0.022 | 0.232 | 0.133 | 0.034 | 0.024 | 0.188 | 0.043 | 0.012 | 0.026 | 0.069 | 0.110 | 0.107 |
| P5 | 0.055 | 0.147 | 0.111 | 0.217 | 0.149 | 0.167 | 0.033 | 0.014 | 0.012 | 0.040 | 0.035 | 0.019 |
| P6 | 0.013 | 0.242 | 0.158 | 0.043 | 0.070 | 0.165 | 0.059 | 0.028 | 0.055 | 0.056 | 0.069 | 0.043 |
| P8 | 0.016 | 0.201 | 0.199 | 0.076 | 0.076 | 0.218 | 0.022 | 0.028 | 0.006 | 0.058 | 0.059 | 0.042 |
| P9 | 0.006 | 0.180 | 0.240 | 0.063 | 0.063 | 0.213 | 0.042 | 0.034 | 0.011 | 0.048 | 0.061 | 0.040 |
16.5 Improved Clustering (Tag-Based)
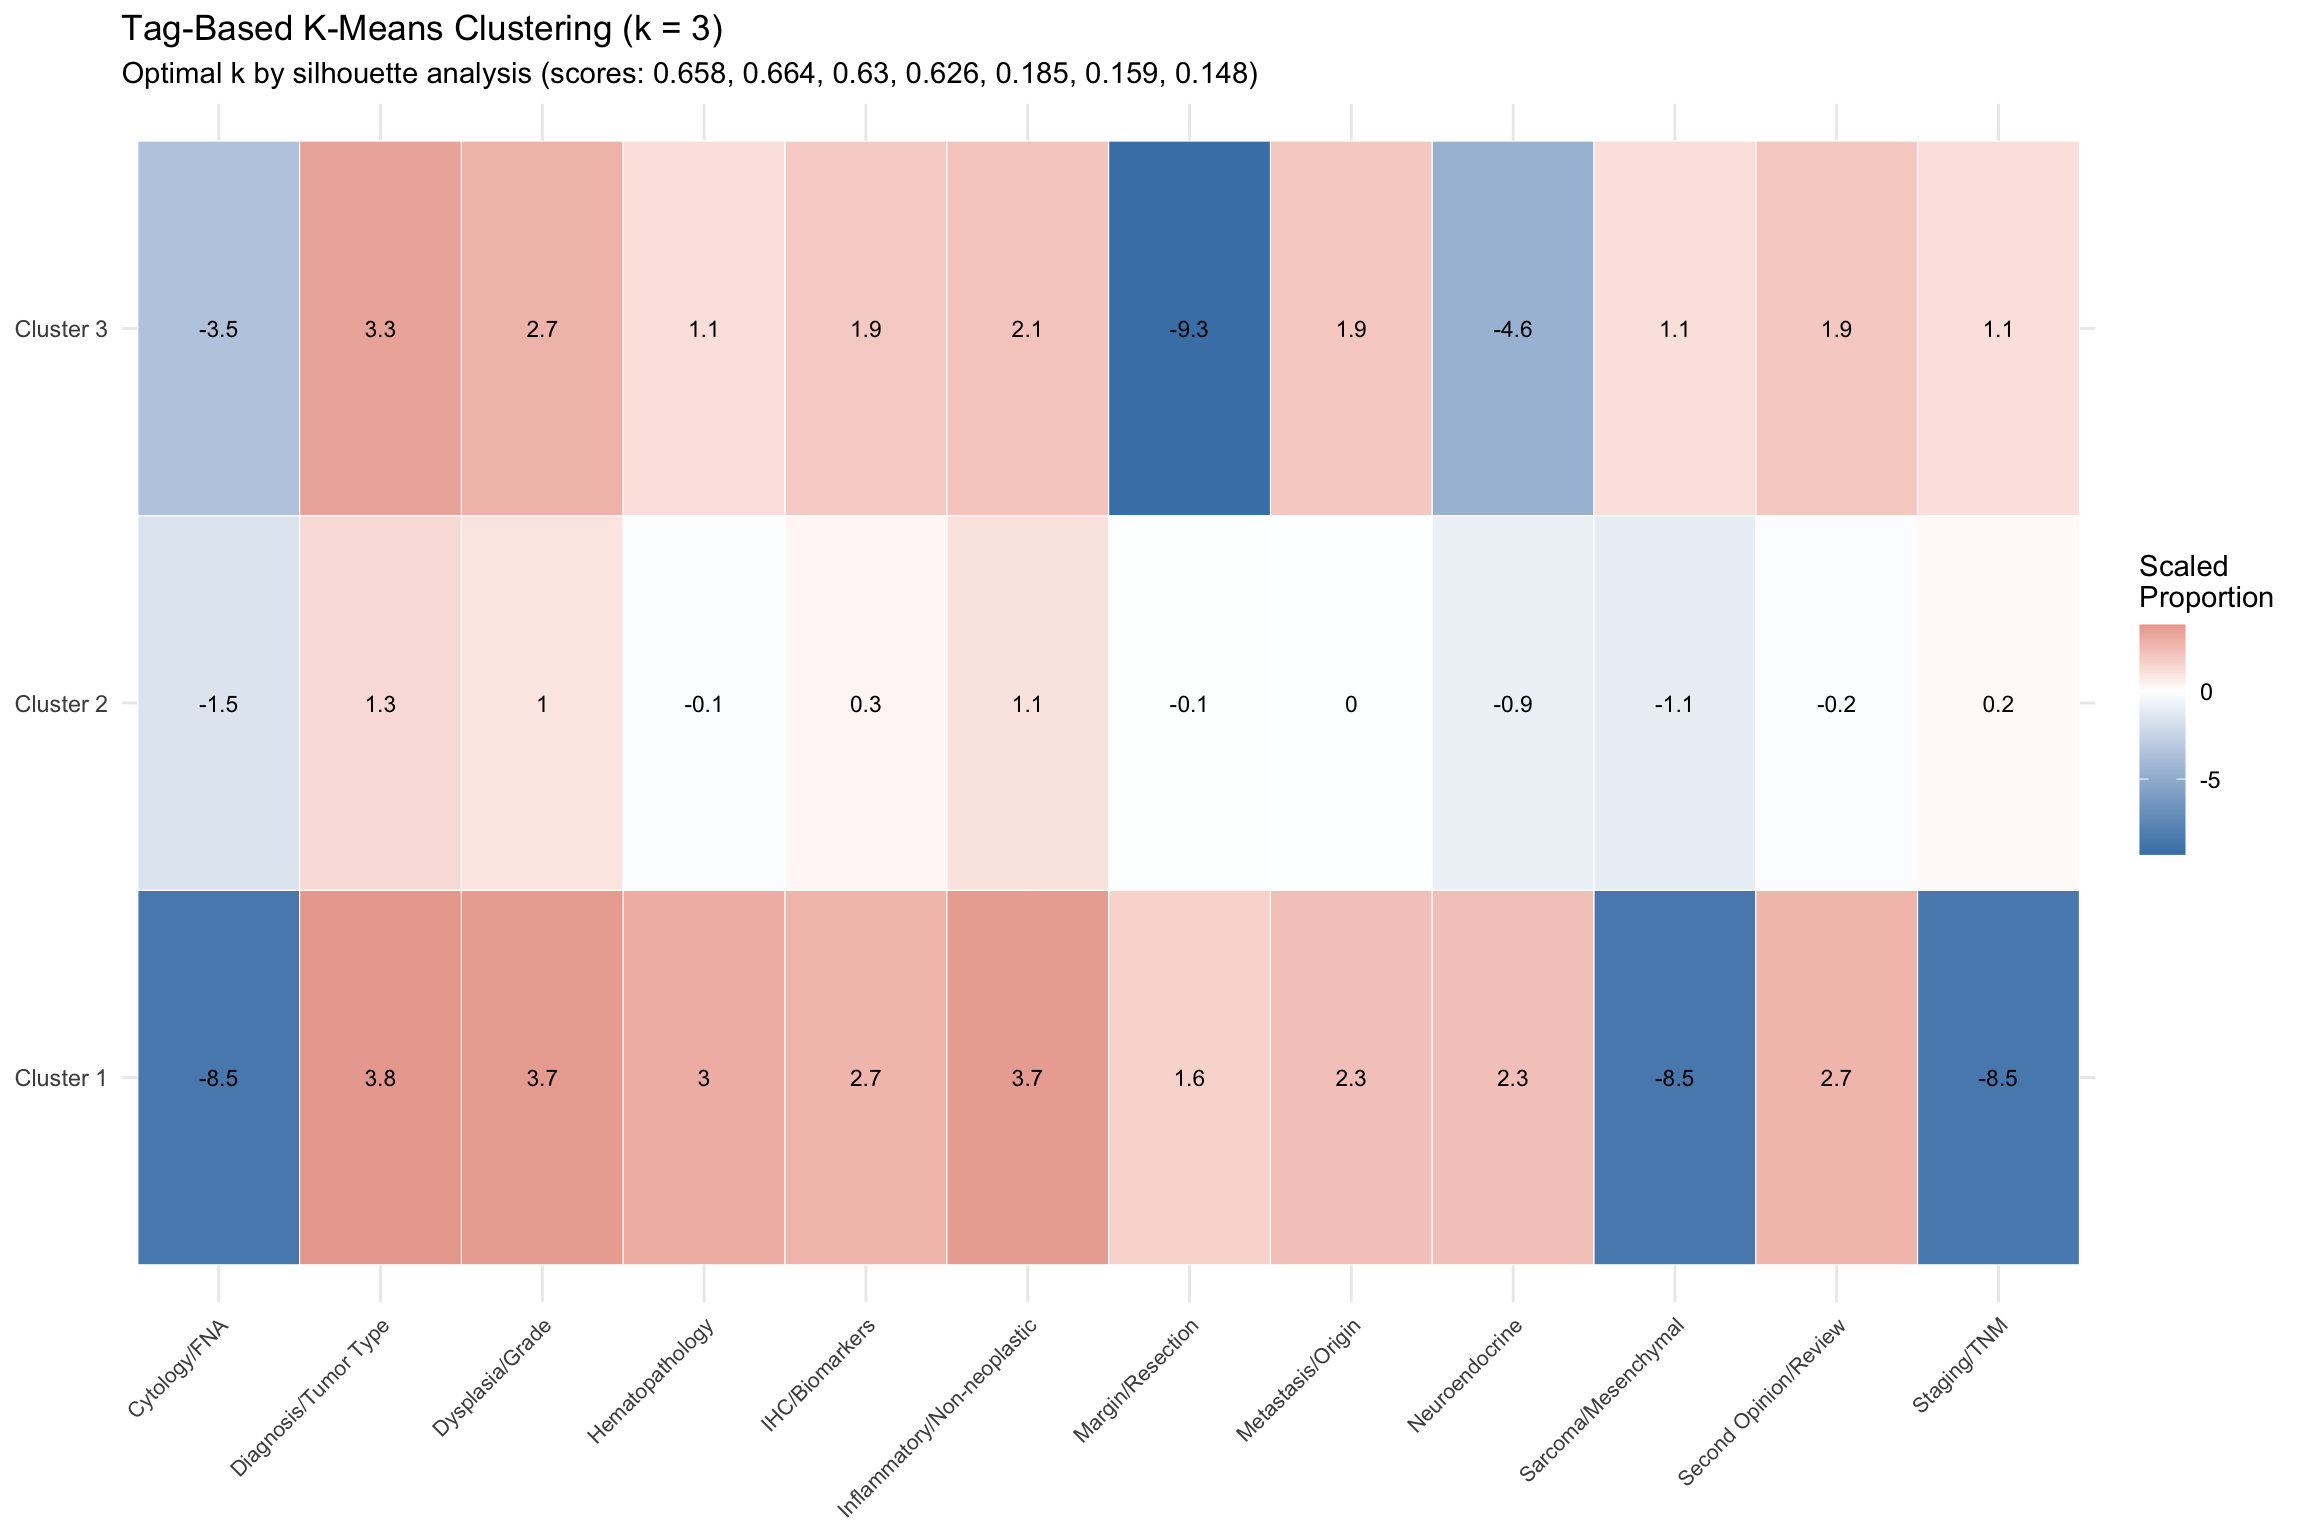
Using the richer tag-based features, we determine the optimal number of clusters via silhouette analysis and perform k-means clustering.
NoteInterpretation
This figure shows what each data-driven cluster “looks like” in terms of consultation topics. Each row is a cluster, and the color intensity shows how much that cluster is associated with each category. Red means the cluster has a strong association with that topic; blue means a weak one. The optimal number of clusters (k) was chosen using silhouette analysis, which measures how well-separated the groups are – higher silhouette scores indicate more distinct clusters.
16.5.1 Cluster Characterization
| Cluster | N | Top 3 Categories | Median TAT (h) | IQR TAT (h) | Avg Tags |
|---|---|---|---|---|---|
| 1 | 1 | N_Pathologists (100%), Diagnosis/Tumor Type (22%), Dysplasia/Grade (20%) | 6.1 | 19.7 | 2.2 |
| 2 | 20 | N_Pathologists (2000%), Diagnosis/Tumor Type (21%), Inflammatory/Non-neoplastic (17%) | 3.2 | 8.8 | 2.6 |
| 3 | 2 | N_Pathologists (200%), Diagnosis/Tumor Type (31%), Dysplasia/Grade (17%) | 9.7 | 9.5 | 2.3 |
NoteInterpretation
This table summarizes each cluster of pathologists by their dominant consultation topics, median turnaround time (TAT), and the average number of topic tags per consultation. Clusters with higher average tag counts handle more multi-faceted cases. Differences in median TAT between clusters may reflect differences in case complexity rather than individual pathologist efficiency.
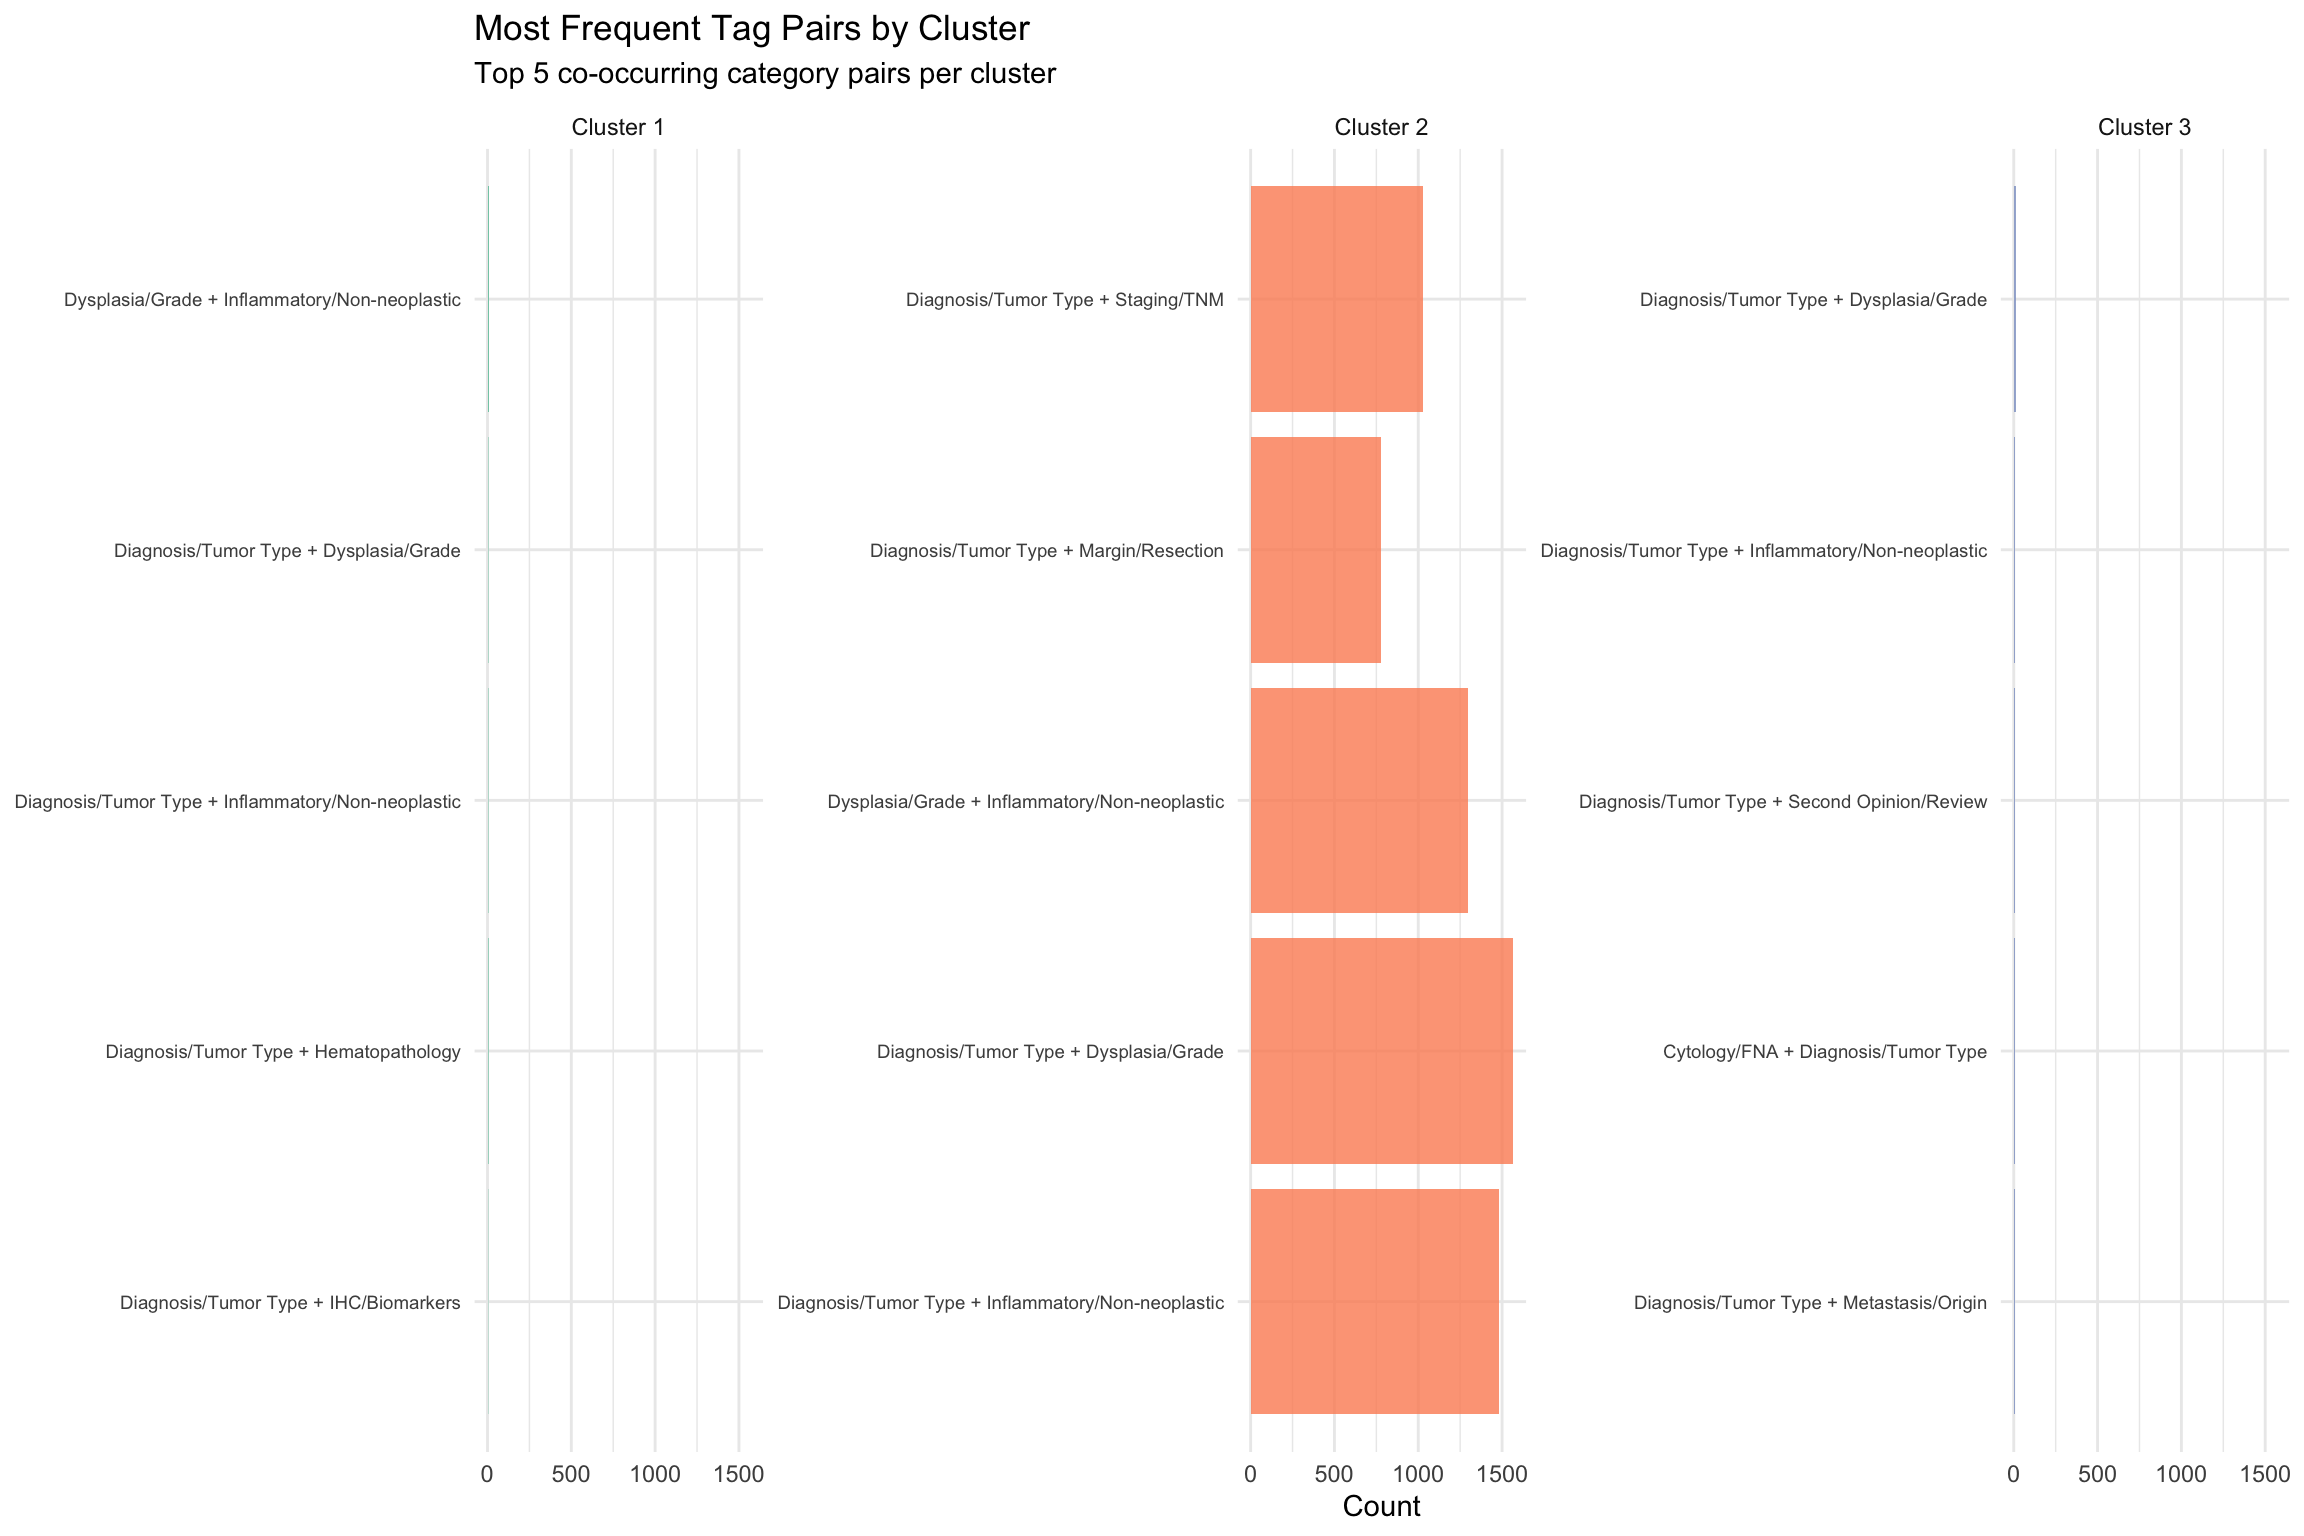
16.5.2 Tag Co-occurrence by Cluster
Which tag combinations are most common in each cluster?