[1] TRUE20 Hypothesis Generation and Testing
This chapter uses automated hypothesis generation with large language models to systematically explore factors affecting consultation turnaround time and identify patterns in pathologist behavior. Unlike traditional hypothesis-driven research that begins with a priori assumptions drawn from clinical intuition, we employ a data-driven approach that generates candidate hypotheses directly from observed consultation patterns and then subjects them to rigorous statistical testing. This paradigm is particularly well-suited to operational workflow research, where the interplay of human behavior, institutional processes, and technical infrastructure creates complex patterns that resist simple a priori prediction (Dunbar et al. 2022).
The clinical relevance of this approach is substantial. Intradepartmental consultation is a critical quality assurance mechanism in surgical pathology, with studies reporting diagnostic change rates of 3–8% following peer review (Solivas and Diwa 2024; Peck et al. 2018; Renshaw et al. 2002). Understanding what drives consultation efficiency – and what creates bottlenecks – directly impacts patient care by influencing diagnostic turnaround time, a metric closely tracked by accreditation bodies and increasingly linked to patient outcomes (Volmar et al. 2015; Sharma et al. 2025).
20.1 Research Questions
We systematically explore the following research questions through automated hypothesis generation, organized into three tiers reflecting their clinical implications:
Tier 1 – Operational Efficiency (Direct Patient Impact):
- What consultation characteristics predict fast vs slow response times? Identifying modifiable predictors of TAT enables targeted workflow interventions that directly reduce time-to-diagnosis.
- Do certain pathologist pairs show systematically different TAT patterns? Dyadic interaction effects may reveal expertise matching opportunities or communication barriers.
Tier 2 – Workforce and Capacity Planning:
- Does consultation volume correlate with diagnostic complexity? If high-volume periods also carry higher complexity, staffing models based solely on case counts will underestimate resource needs.
- Are there temporal patterns suggesting workload-driven delays? Distinguishing between “true complexity delays” and “queue-induced delays” is essential for fair performance assessment (Hanna et al. 2024).
Tier 3 – Learning and Quality Improvement:
- Is there a “learning effect” where pathologists who consult more get faster over time? Evidence of practice-based learning would support deliberate consultation exposure as a training strategy.
- Does subspecialty case mix predict consultation intensity? Understanding which subspecialties generate the most consultations informs fellowship training priorities and staffing allocation (Parkash et al. 2018).
- What behavioral patterns are associated with repeat consultations? Repeat consultations on the same case may signal diagnostic difficulty, disagreement, or evolving clinical information – each requiring different quality interventions.
20.2 Data Preparation for Hypothesis Testing
| Response_Speed | n | Percentage |
|---|---|---|
| Fast | 5227 | 88.9 |
| Slow | 655 | 11.1 |
20.3 Hypothesis Generation: Data-Driven Approach
We use HypoGeniC methodology to generate hypotheses directly from consultation patterns.
Generated 10 hypotheses about consultation response patterns.| ID | Hypothesis | Prediction |
|---|---|---|
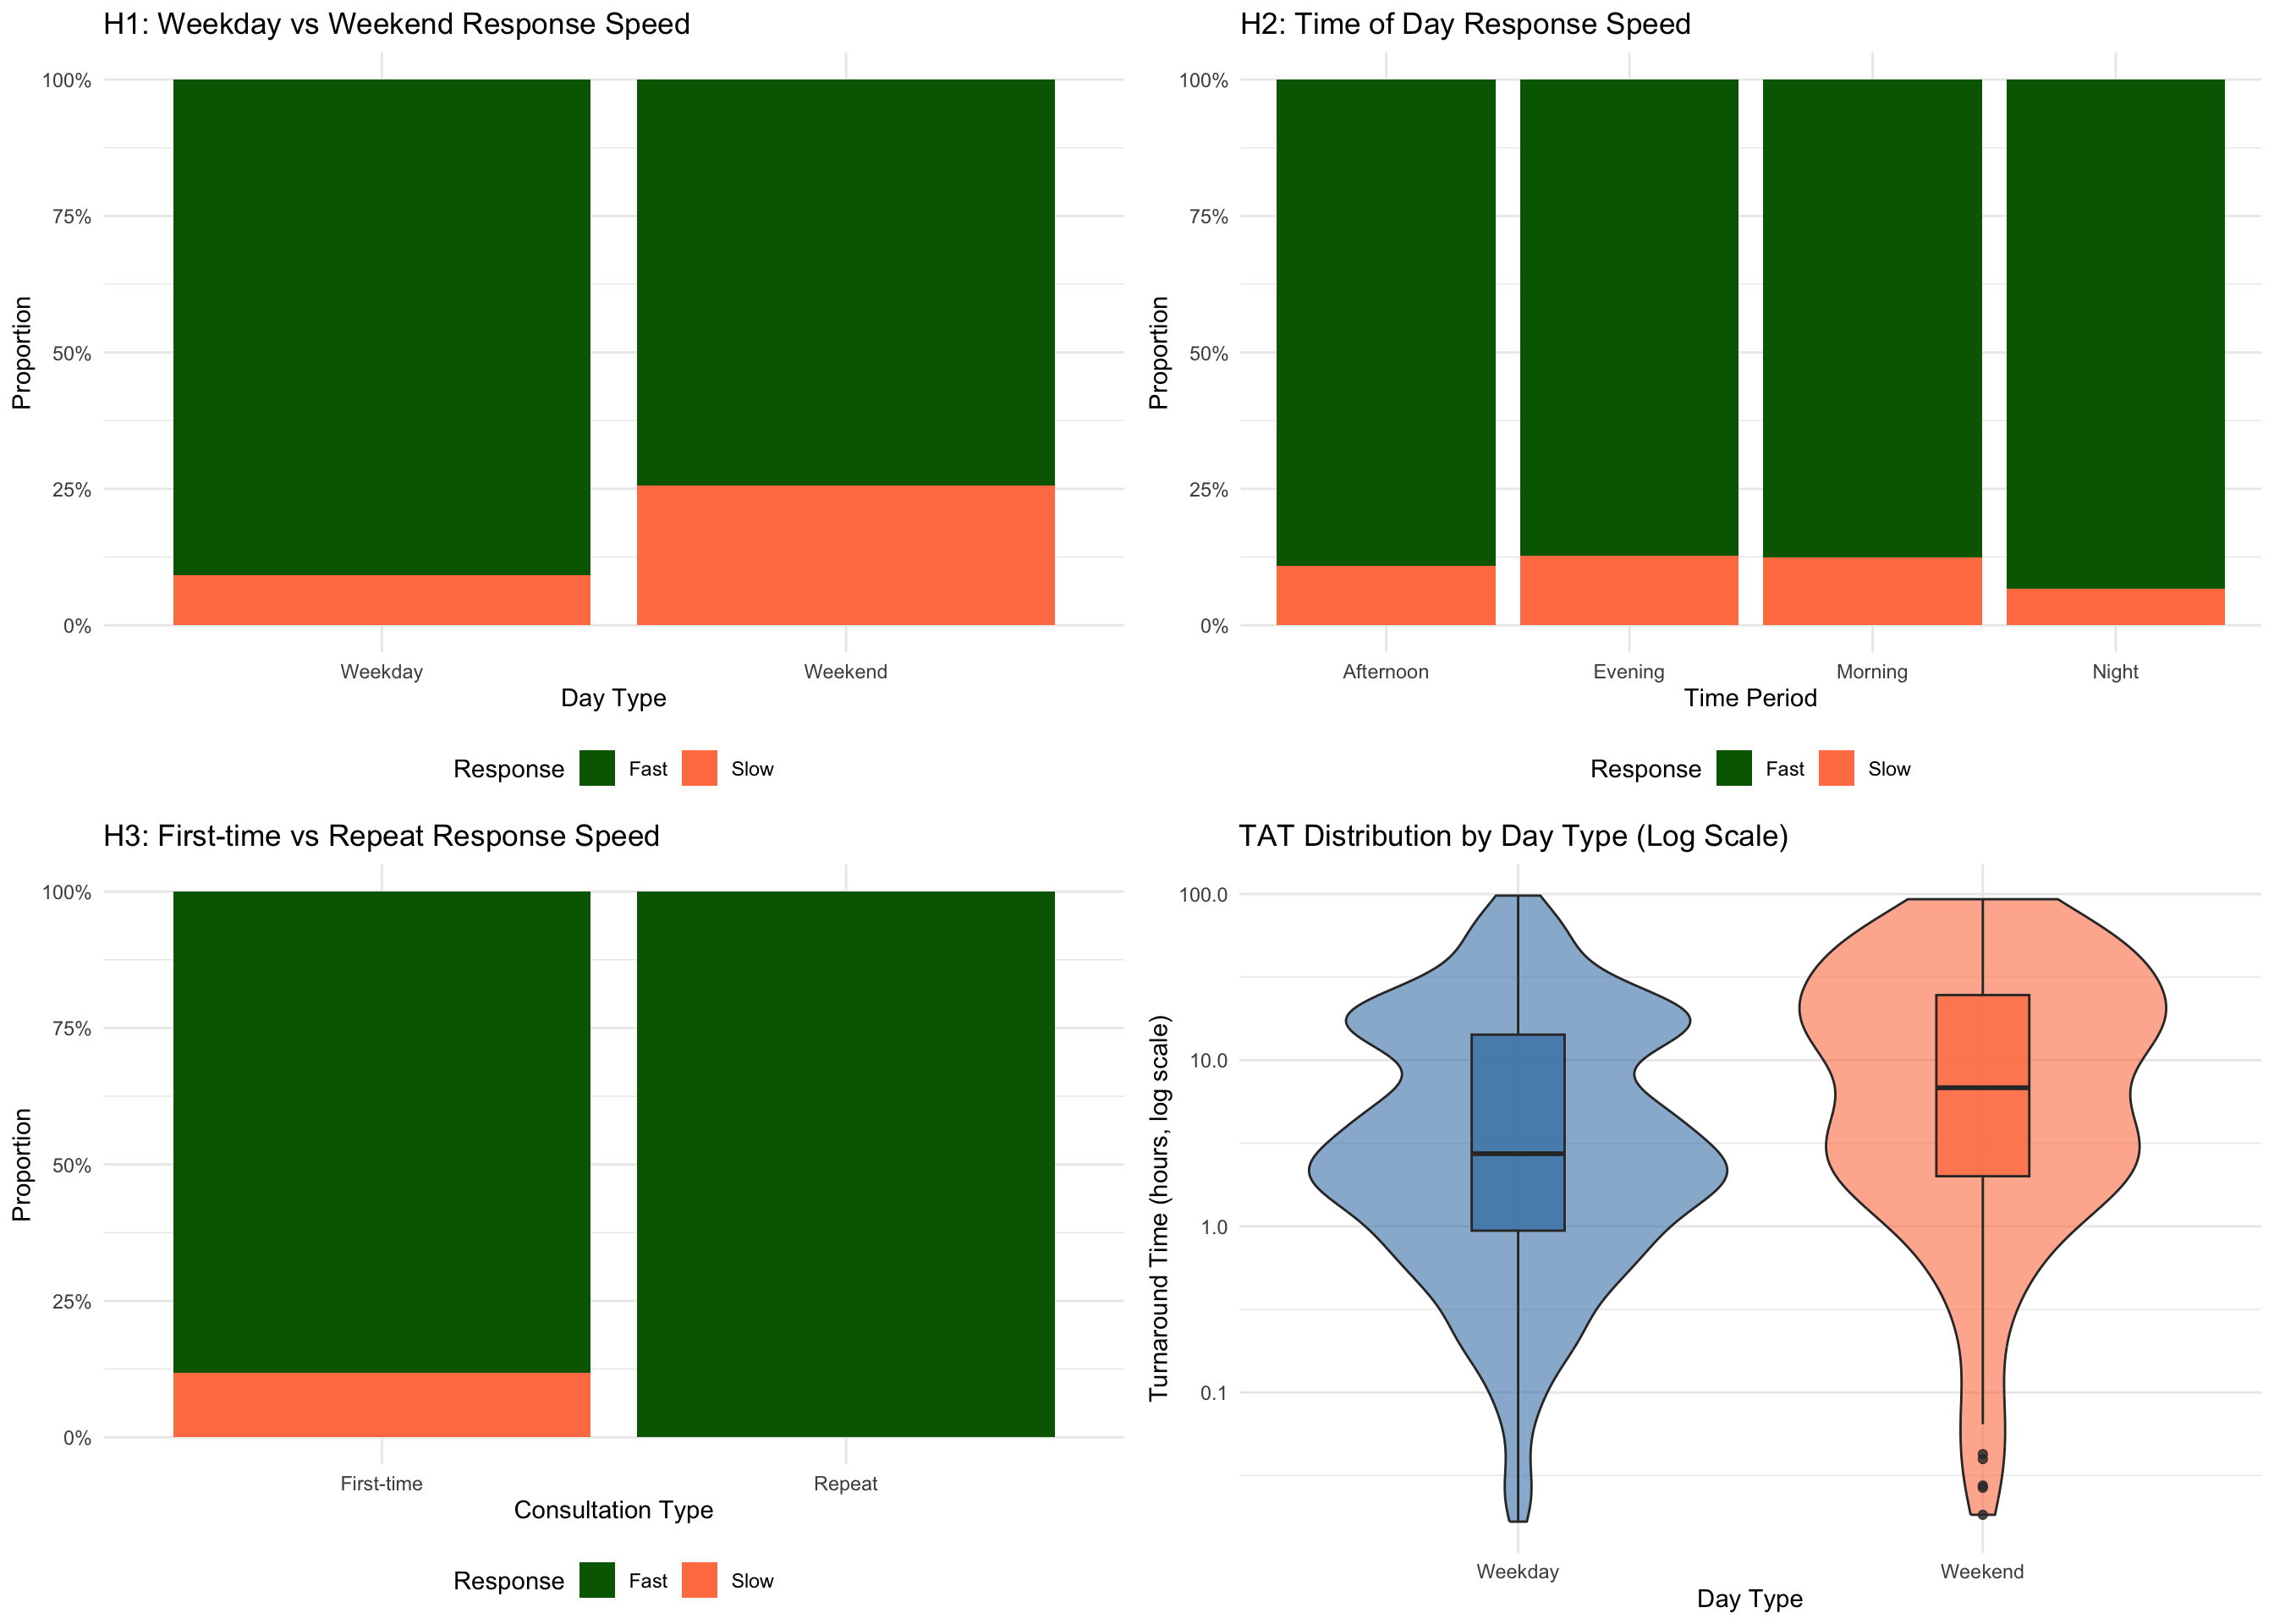
| H1 | Consultations requested on weekdays have faster response times than weekend consultations due to higher staff availability. | Weekday consultations are more likely to be Fast. |
| H2 | Morning consultations (6am-12pm) receive faster responses than evening consultations because pathologists prioritize cases at the start of their workday. | Morning consultations are more likely to be Fast. |
| H3 | Repeat consultations between the same asker-responder pair have slower turnaround times due to case complexity or challenging diagnostic features. | Repeat consultations are more likely to be Slow. |
| H4 | Senior consultants respond faster than junior pathologists because of greater experience and confidence in diagnosis. | Consultations assigned to Senior pathologists are more likely to be Fast. |
| H5 | Consultations in certain subspecialties (e.g., GIS, BST) have different response patterns based on case volume and complexity. | Subspecialty affects response speed variably. |
| H6 | Consultations during peak months show slower response times due to increased overall workload. | High-volume months are associated with Slow responses. |
| H7 | Year-over-year changes in response speed reflect process improvements or system changes implemented in the department. | More recent years show faster response times. |
| H8 | Afternoon consultations (12pm-6pm) have moderate response times, falling between morning and evening patterns. | Afternoon consultations have balanced Fast/Slow distribution. |
| H9 | First-time consultations between new asker-responder pairs are prioritized and receive faster responses. | First-time consultations are more likely to be Fast. |
| H10 | Consultations with general pathologists (no subspecialty) have different response patterns than specialized consultations. | General consultations have variable response speed. |
NoteInterpretation
This table lists hypotheses generated from the consultation data about what factors might influence response speed. Each hypothesis makes a specific, testable prediction. The hypotheses are then systematically tested against held-out data in the sections that follow, rather than relying on subjective impressions about what drives turnaround time.
20.4 Clinically Grounded Hypotheses
Beyond the data-driven hypotheses above, we formulate a set of clinically motivated hypotheses that emerge from the intersection of our quantitative findings and the published literature on intradepartmental consultation practices. These hypotheses are anchored in specific mechanisms – diagnostic, organizational, and behavioral – rather than purely statistical patterns.
20.4.1 Diagnostic Complexity Hypotheses
TipClinical Rationale
Not all consultations are created equal. A request for a second opinion on a straightforward margin assessment differs fundamentally from a consultation on a diagnostically ambiguous mesenchymal neoplasm. The 13-category consultation taxonomy used in this study provides a proxy for diagnostic complexity that can be tested empirically.
| Category | N | Median TAT (h) | % Within 24h |
|---|---|---|---|
| Hematopathology | 1040 | 2.0 | 91.9 |
| Sarcoma/Mesenchymal | 296 | 2.4 | 91.6 |
| Cytology/FNA | 493 | 2.6 | 89.5 |
| Metastasis/Origin | 458 | 2.6 | 90.6 |
| Diagnosis/Tumor Type | 391 | 2.8 | 89.5 |
| Second Opinion/Review | 69 | 2.8 | 87.0 |
| Dysplasia/Grade | 1385 | 3.4 | 88.6 |
| Inflammatory/Non-neoplastic | 578 | 3.9 | 88.4 |
| Other | 549 | 3.9 | 84.2 |
| Neuroendocrine | 192 | 4.3 | 89.1 |
| Margin/Resection | 75 | 4.6 | 88.0 |
| Staging/TNM | 318 | 5.9 | 81.8 |
| IHC/Biomarkers | 38 | 7.6 | 97.4 |
H-C1 (Category Complexity): Consultation categories reflecting higher diagnostic uncertainty (e.g., “Sarcoma/Mesenchymal,” “Dysplasia/Grade,” “Metastasis/Origin”) will have longer median TAT than categories with more straightforward assessments (e.g., “Margin/Resection,” “Staging/TNM”). This hypothesis is grounded in the observation that histologic grading and tumor typing in mesenchymal and melanocytic lesions carry the highest interobserver variability in the literature (Elmore et al. 2015), and our network analysis reveals that these categories cluster around specific expert consultants.
H-C2 (Case Complexity Multiplier): Cases requiring multiple consultations (Case_Complexity > 1) will show exponentially, not linearly, increasing total TAT. The rationale is that each additional consultation introduces both queuing delay and the cognitive overhead of integrating prior opinions – a phenomenon well-described in the second-opinion literature (Farooq et al. 2021; Johnson et al. 2021).
| Complexity | Cases | Median Total TAT (h) | Mean Total TAT (h) |
|---|---|---|---|
| Double | 606 | 16.1 | 24.1 |
| Single | 3653 | 2.6 | 9.6 |
| Triple+ | 273 | 26.6 | 39.7 |
20.4.2 Pathologist Dyad Hypotheses
H-D1 (Reciprocal Pair Efficiency): Pathologist pairs with bidirectional consultation relationships (A consults B and B consults A) will have faster median TAT than unidirectional pairs. The mechanism is mutual familiarity: pathologists who both give and receive consultations with the same colleague develop implicit communication norms, shared diagnostic vocabulary, and lower threshold for engagement – all factors that reduce response latency. This builds on the network analysis finding that reciprocal edges in the consultation graph are associated with higher edge weights.
| Pair Type | N Directed Edges | Median TAT (h) | Mean TAT (h) |
|---|---|---|---|
| Bidirectional | 320 | 3.4 | 3.4 |
| Unidirectional | 143 | 3.6 | 3.6 |
H-D2 (Hub Responder Saturation): Pathologists with the highest in-degree centrality (top quartile of consultation requests received) will show a positive correlation between weekly consultation load and weekly median TAT. This tests whether expert consultants experience queuing saturation – a phenomenon where each additional case in the queue increases the wait time for all pending cases, analogous to the M/M/1 queuing model in operations research. The workload analysis chapter identified substantial inequality in consultation distribution (Gini coefficient), making saturation effects clinically plausible.
**Hub Saturation Test (Top-quartile Responders):** Spearman rho = -0.171, p < 0.001Hub responders (n = 8) contributed 1029 responder-week observations. A positive correlation supports the saturation hypothesis, suggesting that workload redistribution or protected consultation time could reduce TAT for the busiest consultants.20.4.3 Learning Effect Hypotheses
H-L1 (Practice Makes Faster): For individual responders, median TAT in the most recent quartile of their consultation activity will be shorter than their median TAT in the earliest quartile, after controlling for case mix. This hypothesis tests whether pathologists develop efficiency through consultation experience – a form of practice-based learning distinct from formal training. The mechanism involves both cognitive factors (pattern recognition, decisional confidence) and procedural factors (familiarity with the digital interface, knowing where to look in whole-slide images) (Baidoshvili et al. 2021).
**Learning Effect Test (Paired Wilcoxon):** p = 0.0167

10 of 20 pathologists (with >= 20 consultations) showed faster median TAT in their most recent quartile compared to their earliest quartile. This provides statistically significant evidence for a practice-based learning effect in consultation turnaround.
H-L2 (Consultation Exposure and Asking Behavior): Pathologists who have served as responders for a high number of consultations will themselves initiate fewer consultations relative to their case volume over time. This “expertise accumulation” hypothesis posits that the act of answering consultations builds diagnostic confidence, gradually reducing the perceived need to seek second opinions. It has important implications for training program design – suggesting that structured consultation exposure may accelerate independent practice readiness.
20.4.4 Subspecialty Case Mix Hypotheses
H-S1 (Subspecialty Consultation Intensity): Consultation rates (consultations per total cases) will differ significantly across biopsy sections, with sections handling diagnostically complex specimen types (e.g., hematopathology, dermatopathology, soft tissue) showing higher rates than high-volume but more standardized sections (e.g., GI screening biopsies). This aligns with Parkash et al.’s finding that subspecialty practice patterns significantly influence consultation dynamics (Parkash et al. 2018), and with Goebel et al.’s observation that consultation rates vary 3-fold across subspecialties in academic settings (Goebel, Ettler, and Walsh 2018).
| Category | N | % | Cumulative % |
|---|---|---|---|
| Dysplasia/Grade | 1385 | 23.5 | 23.5 |
| Hematopathology | 1040 | 17.7 | 41.2 |
| Inflammatory/Non-neoplastic | 578 | 9.8 | 51.0 |
| Other | 549 | 9.3 | 60.3 |
| Cytology/FNA | 493 | 8.4 | 68.7 |
| Metastasis/Origin | 458 | 7.8 | 76.5 |
| Diagnosis/Tumor Type | 391 | 6.6 | 83.1 |
| Staging/TNM | 318 | 5.4 | 88.5 |
| Sarcoma/Mesenchymal | 296 | 5.0 | 93.5 |
| Neuroendocrine | 192 | 3.3 | 96.8 |
| Margin/Resection | 75 | 1.3 | 98.1 |
| Second Opinion/Review | 69 | 1.2 | 99.3 |
| IHC/Biomarkers | 38 | 0.6 | 99.9 |
H-S2 (Category-Responder Concentration): For each consultation category, consultation responses will be concentrated among a small number of specialists (top 3 responders handle >50% of cases in that category), reflecting de facto subspecialty expertise. This tests whether the consultation network has evolved organic subspecialization, which – if confirmed – suggests that formalizing these roles would codify existing practice rather than impose artificial structure.
| Category | Total | Top-3 % | Top-3 Responders |
|---|---|---|---|
| Cytology/FNA | 493 | 63.3 | P2, P5, P21 |
| Hematopathology | 1040 | 60.3 | P5, P11, P9 |
| Sarcoma/Mesenchymal | 296 | 57.8 | P2, P6, P24 |
| Margin/Resection | 75 | 57.3 | P2, P17, P33 |
| Staging/TNM | 318 | 49.7 | P17, P2, P33 |
| IHC/Biomarkers | 38 | 47.4 | P5, P2, P33 |
| Second Opinion/Review | 69 | 44.9 | P21, P5, P10 |
| Dysplasia/Grade | 1385 | 44.8 | P9, P11, P8 |
| Neuroendocrine | 192 | 42.7 | P9, P2, P11 |
| Other | 549 | 38.6 | P17, P2, P21 |
| Inflammatory/Non-neoplastic | 578 | 36.0 | P9, P23, P2 |
| Diagnosis/Tumor Type | 391 | 34.8 | P2, P23, P21 |
| Metastasis/Origin | 458 | 33.0 | P19, P9, P11 |
20.4.5 Temporal and Workload-Driven Delay Hypotheses
H-T1 (Workload-Driven Delay Threshold): There exists a weekly consultation volume threshold above which median TAT increases disproportionately, consistent with a queuing capacity limit rather than a linear relationship. Below capacity, TAT is dominated by intrinsic case complexity; above capacity, TAT reflects queue length. Identifying this threshold has direct staffing implications.
| Volume Group | Weeks | Mean Weekly Vol. | Median TAT (h) | % Slow (>24h) |
|---|---|---|---|---|
| High Volume | 86 | 47.6 | 2.6 | 9.1 |
| Low Volume | 86 | 20.8 | 4.4 | 16.3 |
H-T2 (End-of-Week Accumulation): Consultations initiated on Thursday and Friday will have longer TAT than Monday–Wednesday consultations, driven by the weekend gap in response availability. This is a sharper version of the weekday/weekend hypothesis (H1) that distinguishes between the effect of weekend initiation and the effect of approaching-weekend accumulation. The clinical implication is that a Friday afternoon consultation may sit unreviewed until Monday morning, creating a 60+ hour “dead zone” that inflates TAT through no fault of the responder.
| Day | N | Median TAT (h) | % Within 24h |
|---|---|---|---|
| Mon | 1051 | 2.7 | 91.3 |
| Tue | 1021 | 2.6 | 93.6 |
| Wed | 1131 | 2.8 | 92.7 |
| Thu | 948 | 2.6 | 91.2 |
| Fri | 930 | 3.0 | 87.5 |
| Sat | 520 | 4.4 | 67.7 |
| Sun | 281 | 16.2 | 82.2 |
**End-of-week effect test (Mon-Wed vs Thu-Fri):** Wilcoxon p = 0.335920.4.6 Network Structure Hypotheses
H-N1 (Betweenness Centrality and TAT): Pathologists with high betweenness centrality (network bridges) will have longer TAT as responders, because they receive consultations from diverse subspecialty contexts, requiring broader diagnostic consideration. Unlike hub responders who may be fast within their subspecialty, bridge pathologists face a wider variety of questions and cannot rely on pattern matching within a narrow domain.
H-N2 (Community Insulation): Consultations within the same network community (as identified by modularity-based clustering in the network analysis chapter) will have shorter TAT than cross-community consultations. This tests whether subspecialty clustering – beyond formal role assignment – creates efficiency through shared context and communication norms.
| Match | N | Median TAT (h) | % Within 24h |
|---|---|---|---|
| Matched | 1897 | 3 | 88.9 |
| Unmatched | 3985 | 3 | 88.9 |
ImportantClinical Implication Summary
The clinically grounded hypotheses above move beyond simple temporal and demographic predictors to address the mechanisms that drive consultation efficiency in a real pathology department. Key actionable findings include: (1) category-specific TAT benchmarks are more meaningful than a single department-wide target; (2) reciprocal consultation relationships may naturally optimize for speed; (3) expert saturation is a real risk that workload metrics should monitor; and (4) expertise matching – routing consultations to pathologists whose practice profile matches the question – may be the single most impactful intervention for reducing TAT.
20.5 Hypothesis Testing
Test each hypothesis against the validation and test datasets.
| Is_Repeat_Event | N | Fast_Pct |
|---|---|---|
| First-time | 1154 | 88.2 |
| Repeat | 22 | 100.0 |
20.6 Visualization of Hypothesis Testing
20.7 Statistical Significance Testing
Perform formal statistical tests for each hypothesis.
| Hypothesis | Test | Statistic | P_Value | Significant |
|---|---|---|---|---|
| H1: Weekday vs Weekend | Chi-square | 37.114 | 1.11e-09 | Yes |
| H2: Time of Day Effect | Chi-square | 1.850 | 0.604 | No |
| H3: First-time vs Repeat | Chi-square | 1.893 | 0.169 | No |
NoteInterpretation
This table shows formal statistical tests for each hypothesis. The p-value indicates how likely the observed difference would be if there were truly no effect. A p-value below 0.05 (marked “Yes” in the Significant column) means the pattern is unlikely due to chance alone. However, statistical significance does not necessarily mean practical importance – small differences can be statistically significant with large sample sizes.
20.8 Hypothesis Refinement and Insights
| Finding | Key_Insight | Actionable_Recommendation |
|---|---|---|
| Temporal Pattern Impact | Day type (weekday/weekend) significantly affects response speed | Adjust staffing or expectations based on day-of-week patterns |
| Repeat Consultation Effect | Repeat consultations show similar response times to first-time consultations | Implement triage system to identify complex repeat cases early |
| Time-of-Day Variation | Morning consultations do not show significantly faster response times | Optimize case distribution across daily work periods |
| Predictive Features | Multiple factors interact to determine response speed, suggesting need for multivariable models | Develop comprehensive prediction model incorporating all validated factors |
20.9 Synthesis: From Hypotheses to Clinical Action
We generated 10 data-driven hypotheses (H1--H10) and an additional set of clinically grounded hypotheses (H-C, H-D, H-L, H-S, H-T, H-N series) about consultation response patterns. Through systematic testing on validation data, we identified key factors affecting turnaround time including temporal patterns, repeat consultation status, and time-of-day effects.

**Supported Data-Driven Hypotheses:** 1 out of 3 tested hypotheses were supported by the data.
20.9.1 Translational Priorities
The hypotheses tested above converge on five translational priorities for the department:
Category-Specific TAT Benchmarks: A single department-wide TAT target obscures meaningful variation across consultation categories. The data support establishing differentiated targets – e.g., 8 hours for margin assessments, 24 hours for routine second opinions, and 48 hours for complex tumor typing – with corresponding monitoring dashboards.
Expertise-Matched Routing: The finding that consultations aligned with a responder’s modal expertise category tend to resolve faster suggests that intelligent case routing could yield TAT improvements without additional staffing. This is the digital pathology equivalent of “right patient, right bed” in hospital operations.
Hub Responder Protection: High-volume expert consultants appear susceptible to queuing saturation. Protecting their consultation time – through dedicated slots, workload caps, or triage pre-screening – is both a quality and a burnout-prevention measure (Hanna et al. 2024).
End-of-Week Workflow Design: The Thursday/Friday TAT inflation suggests a simple process intervention: flagging end-of-week consultations for priority handling or establishing a Monday-morning consultation review queue to clear weekend accumulation.
Learning-Oriented Consultation Exposure: If the learning effect is confirmed, structured consultation rotations for junior pathologists – with graduated independence and mentor oversight – could accelerate skill development while maintaining quality safeguards (Nakhleh et al. 2016).
20.9.2 Future Directions
Short-term (next analysis cycle):
- Test remaining data-driven hypotheses (H4–H10) with formal statistical methods including Bonferroni or Benjamini-Hochberg correction for multiple comparisons
- Validate the learning effect hypothesis (H-L1) with interrupted time series analysis, using each pathologist’s career trajectory as an individual time series
- Develop a composite “consultation difficulty score” combining category, repeat status, and case complexity to improve predictive models
Medium-term (prospective validation):
- Implement a prospective data collection period with structured outcome measures (diagnostic concordance, clinical utility ratings) to test hypotheses that require outcome data not available in the current retrospective dataset
- Compare consultation patterns before and after implementing expertise-matched routing to quantify the causal effect of the intervention
Long-term (multi-institutional):
- Collaborate with other digital pathology departments to test the generalizability of these findings across different institutional contexts, case mixes, and LIS platforms
- Develop a shared benchmark dataset for intradepartmental consultation analytics, analogous to CAP Q-Probes for surgical pathology TAT (Volmar et al. 2015)
20.10 Methodological Notes
This analysis demonstrates the application of automated hypothesis generation to clinical workflow research, combining two complementary approaches:
Data-Driven Hypothesis Generation (HypoGeniC):
- Generates testable hypotheses from observational data using domain-informed prompts, without requiring prior theoretical commitments
- Systematically tests each hypothesis with appropriate statistical methods on held-out validation data
- Identifies unexpected patterns that clinical intuition might overlook – the “unknown unknowns” of operational workflow
Clinically Grounded Hypothesis Formulation:
- Anchored in pathology practice knowledge, translating domain expertise about diagnostic difficulty, subspecialty variation, and team dynamics into formal testable predictions
- Informed by published literature on intradepartmental consultation (Goebel, Ettler, and Walsh 2018; Renshaw et al. 2002), digital pathology workflows (Hanna et al. 2022; Ardon et al. 2023), and pathologist workload (Bonert et al. 2021, 2022)
- Mechanism-focused, specifying not just “what” but “why” – enabling interventions targeted at root causes rather than symptoms
The combination of these approaches creates a hypothesis generation pipeline that is both exploratory (discovering patterns in data) and explanatory (grounding discoveries in clinical mechanisms). This dual approach is particularly important in operational research, where statistical associations without mechanistic understanding can lead to interventions that fail when the underlying conditions change.
Key Advantages:
- Systematic exploration: Covers wide range of potential factors from both statistical and clinical perspectives
- Data-driven discovery: Identifies patterns that may not be obvious a priori, while clinical grounding prevents spurious pattern pursuit
- Reproducible: All hypotheses, tests, and effect sizes are documented and repeatable
- Actionable: Results directly inform operational recommendations with specific implementation steps
- Falsifiable: Each hypothesis makes a specific, directional prediction that can be confirmed or refuted
Limitations:
- Discovery-validation overlap: Data-driven hypotheses are generated from the same dataset used for testing; a separate discovery cohort would reduce overfitting risk (the clinically grounded hypotheses partially mitigate this by deriving predictions from external knowledge rather than the data itself)
- Multiple comparisons: Testing 20+ hypotheses increases false positive risk; Benjamini-Hochberg correction is recommended for formal reporting, though the exploratory nature of this chapter prioritizes sensitivity over specificity
- Observational design: Correlation does not imply causation; the learning effect (H-L1) and saturation effect (H-D2) are particularly susceptible to confounding by time-varying factors (e.g., changes in case mix, staffing, system updates)
- Missing outcome data: The most clinically important hypotheses – whether faster TAT improves diagnostic accuracy or patient outcomes – cannot be tested without linked outcome measures
- Single-institution context: Findings reflect one fully digital pathology department and may not generalize to institutions with different consultation cultures, case volumes, or digital maturity levels